EXHIBIT 99.2
Published on June 4, 2014
Exhibit 99.2
WWW. CHIMERAREIT.COM Supplemental Financial Information as of March 31, 2014 CHIMERA INVESTMENT CORPORATION
CONFERENCE NAME GOES HERE 22 Information is unaudited, estimated and subject to change. Disclaimer This material is not intended to be exhaustive, is preliminary in nature and may be subject to change. In addition, much of the information contained herein is based on various assumptions (some of which are beyond the control of Chimera Investment Corporation, the “Company”) and may be identified by reference to a future period or periods or by the use of forward-looking terminology, such as “believe,” “expect,” “anticipate,” “estimate,” “plan,” “continue,” “intend,” “should,” “may,” “would,” “projected,” “will” or similar expressions, or variations on those terms or the negative of those terms. The Company’s forward-looking statements are subject to numerous risks, uncertainties and other factors, including the Company’s ability to timely complete the process necessary to file its quarterly and annual reports for the quarters subsequent to December 31, 2013. Furthermore, none of the financial information contained in this material has been audited or approved by the Company’s independent registered public accounting firm.
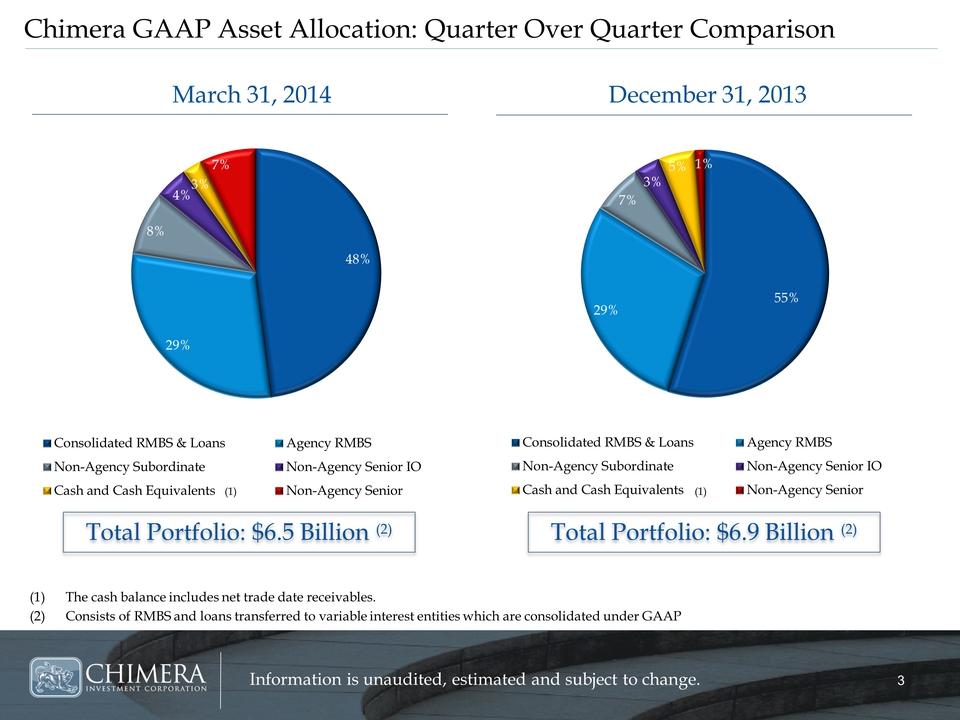
CONFERENCE NAME GOES HERE 33 Information is unaudited, estimated and subject to change. Chimera GAAP Asset Allocation: Quarter Over Quarter Comparison (1) The cash balance includes net trade date receivables. (2) Consists of RMBS and loans transferred to variable interest entities which are consolidated under GAAP March 31, 2014 December 31, 2013 Total Portfolio: $6.5 Billion (2) Total Portfolio: $6.9 Billion (2) 55% 29% 7% 3% 5% 1% Consolidated RMBS & Loans Agency RMBS Non-Agency Subordinate Non-Agency Senior IO Cash and Cash Equivalents Non-Agency Senior (1) 48% 29% 8% 4% 3% 7% Consolidated RMBS & Loans Agency RMBS Non-Agency Subordinate Non-Agency Senior IO Cash and Cash Equivalents Non-Agency Senior (1)
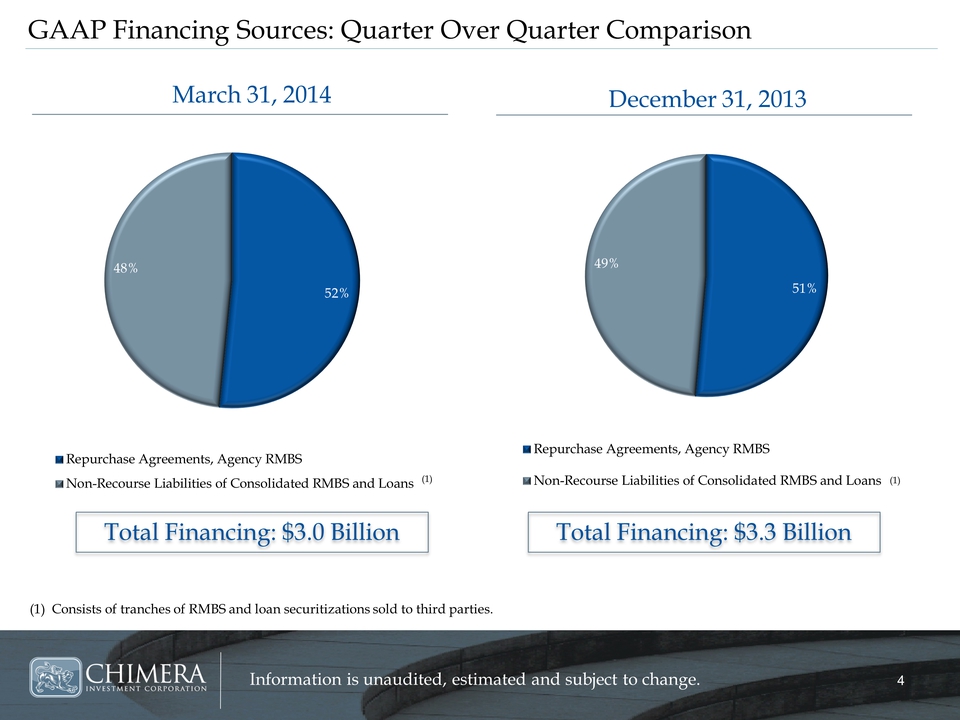
CONFERENCE NAME GOES HERE 44 Information is unaudited, estimated and subject to change. GAAP Financing Sources: Quarter Over Quarter Comparison (1) Consists of tranches of RMBS and loan securitizations sold to third parties. March 31, 2014 December 31, 2013 Total Financing: $3.0 Billion Total Financing: $3.3 Billion (1) (1) 51% 49% Repurchase Agreements, Agency RMBS Non-Recourse Liabilities of Consolidated RMBS and Loans 52% 48% Repurchase Agreements, Agency RMBS Non-Recourse Liabilities of Consolidated RMBS and Loans
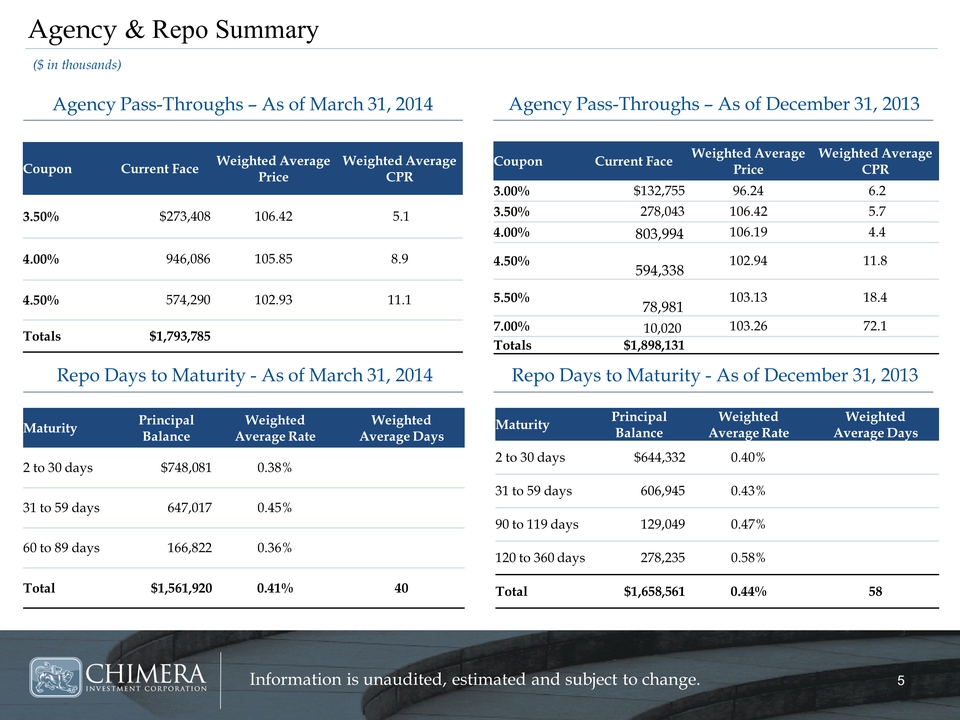
CONFERENCE NAME GOES HERE 55 Information is unaudited, estimated and subject to change. Maturity Principal Balance Weighted Average Rate Weighted Average Days 2 to 30 days $644,332 0.40% 31 to 59 days 606,945 0.43% 90 to 119 days 129,049 0.47% 120 to 360 days 278,235 0.58% Total $1,658,561 0.44% 58 Coupon Current Face Weighted Average Price Weighted Average CPR 3.00% $132,755 96.24 6.2 3.50% 278,043 106.42 5.7 4.00% 803,994 106.19 4.4 4.50% 594,338 102.94 11.8 5.50% 78,981 103.13 18.4 7.00% 10,020 103.26 72.1 Totals $1,898,131 Agency & Repo Summary Agency Pass-Throughs – As of March 31, 2014 Repo Days to Maturity - As of March 31, 2014 Agency Pass-Throughs – As of December 31, 2013 Repo Days to Maturity - As of December 31, 2013 Maturity Principal Balance Weighted Average Rate Weighted Average Days 2 to 30 days $748,081 0.38% 31 to 59 days 647,017 0.45% 60 to 89 days 166,822 0.36% Total $1,561,920 0.41% 40 ($ in thousands) Coupon Current Face Weighted Average Price Weighted Average CPR 3.50% $273,408 106.42 5.1 4.00% 946,086 105.85 8.9 4.50% 574,290 102.93 11.1 Totals $1,793,785
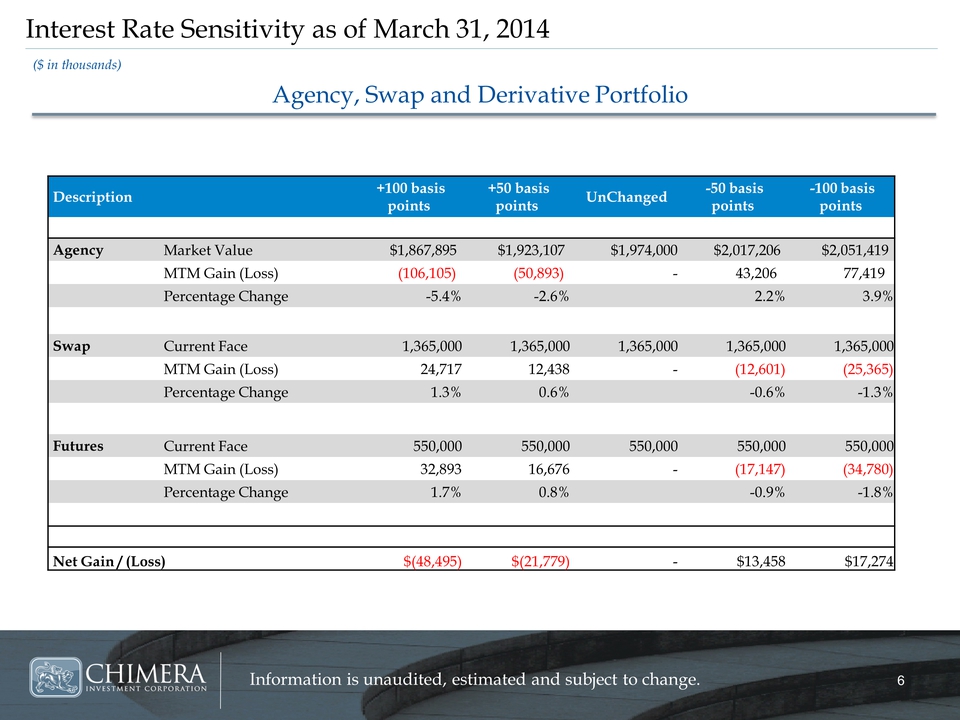
CONFERENCE NAME GOES HERE 66 Information is unaudited, estimated and subject to change. Interest Rate Sensitivity as of March 31, 2014 Description +100 basis points +50 basis points UnChanged -50 basis points -100 basis points Agency Market Value $1,867,895 $1,923,107 $1,974,000 $2,017,206 $2,051,419 MTM Gain (Loss) (106,105) (50,893) - 43,206 77,419 Percentage Change -5.4% -2.6% 2.2% 3.9% Swap Current Face 1,365,000 1,365,000 1,365,000 1,365,000 1,365,000 MTM Gain (Loss) 24,717 12,438 - (12,601) (25,365) Percentage Change 1.3% 0.6% -0.6% -1.3% Futures Current Face 550,000 550,000 550,000 550,000 550,000 MTM Gain (Loss) 32,893 16,676 - (17,147) (34,780) Percentage Change 1.7% 0.8% -0.9% -1.8% Net Gain / (Loss) $(48,495) $(21,779) - $13,458 $17,274 ($ in thousands) Agency, Swap and Derivative Portfolio
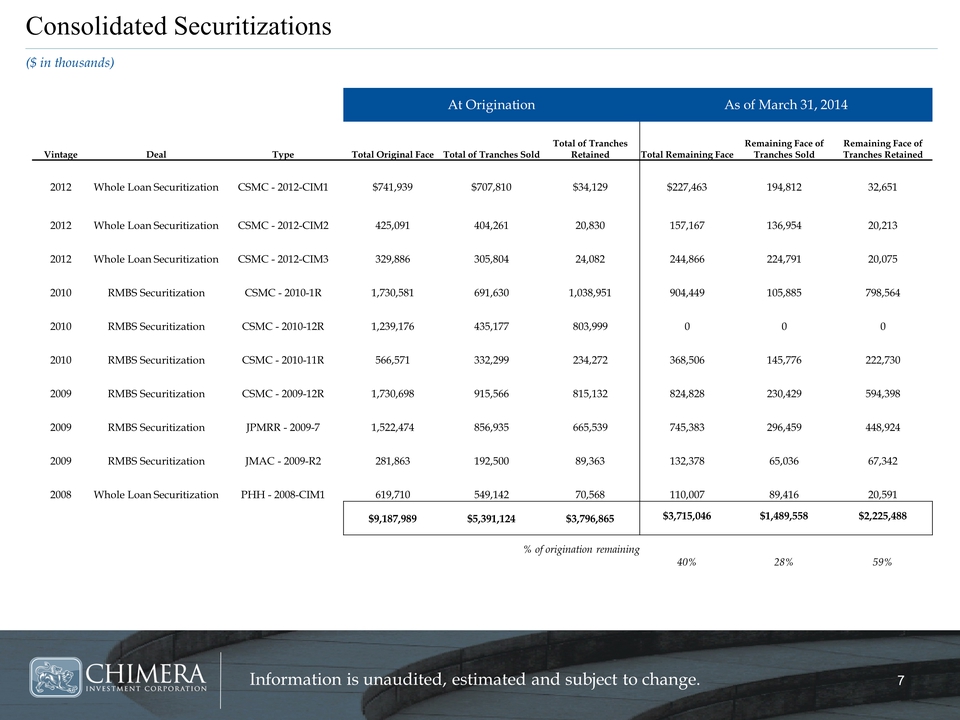
CONFERENCE NAME GOES HERE 77 Information is unaudited, estimated and subject to change. Consolidated Securitizations ($ in thousands) At Origination As of March 31, 2014 Vintage Deal Type Total Original Face Total of Tranches Sold Total of Tranches Retained Total Remaining Face Remaining Face of Tranches Sold Remaining Face of Tranches Retained 2012 Whole Loan Securitization CSMC - 2012-CIM1 $741,939 $707,810 $34,129 $227,463 194,812 32,651 2012 Whole Loan Securitization CSMC - 2012-CIM2 425,091 404,261 20,830 157,167 136,954 20,213 2012 Whole Loan Securitization CSMC - 2012-CIM3 329,886 305,804 24,082 244,866 224,791 20,075 2010 RMBS Securitization CSMC - 2010-1R 1,730,581 691,630 1,038,951 904,449 105,885 798,564 2010 RMBS Securitization CSMC - 2010-12R 1,239,176 435,177 803,999 0 0 0 2010 RMBS Securitization CSMC - 2010-11R 566,571 332,299 234,272 368,506 145,776 222,730 2009 RMBS Securitization CSMC - 2009-12R 1,730,698 915,566 815,132 824,828 230,429 594,398 2009 RMBS Securitization JPMRR - 2009-7 1,522,474 856,935 665,539 745,383 296,459 448,924 2009 RMBS Securitization JMAC - 2009-R2 281,863 192,500 89,363 132,378 65,036 67,342 2008 Whole Loan Securitization PHH - 2008-CIM1 619,710 549,142 70,568 110,007 89,416 20,591 $9,187,989 $5,391,124 $3,796,865 $3,715,046 $1,489,558 $2,225,488 % of origination remaining 40% 28% 59%