EXHIBIT 99.2
Published on August 11, 2014
Exhibit 99.2
 \
\
Q2 2014 Supplemental Financial Information August 11, 2014 WWW.CHIMERAREIT.COM
Disclaimer This material is not intended to be exhaustive, is preliminary in nature and may be subject to change. In addition, much of the information contained herein is based on various assumptions (some of which are beyond the control of Chimera Investment Corporation, the “Company”) and may be identified by reference to a future period or periods or by the use of forward-looking terminology, such as “believe,” “expect,” “anticipate,” “estimate,” “plan,” “continue,” “intend,” “should,” “may,” “would,” “projected,” “will” or similar expressions, or variations on those terms or the negative of those terms. The Company’s forward-looking statements are subject to numerous risks, uncertainties and other factors. Furthermore, none of the financial information contained in this material has been audited or approved by the Company’s independent registered public accounting firm. 2
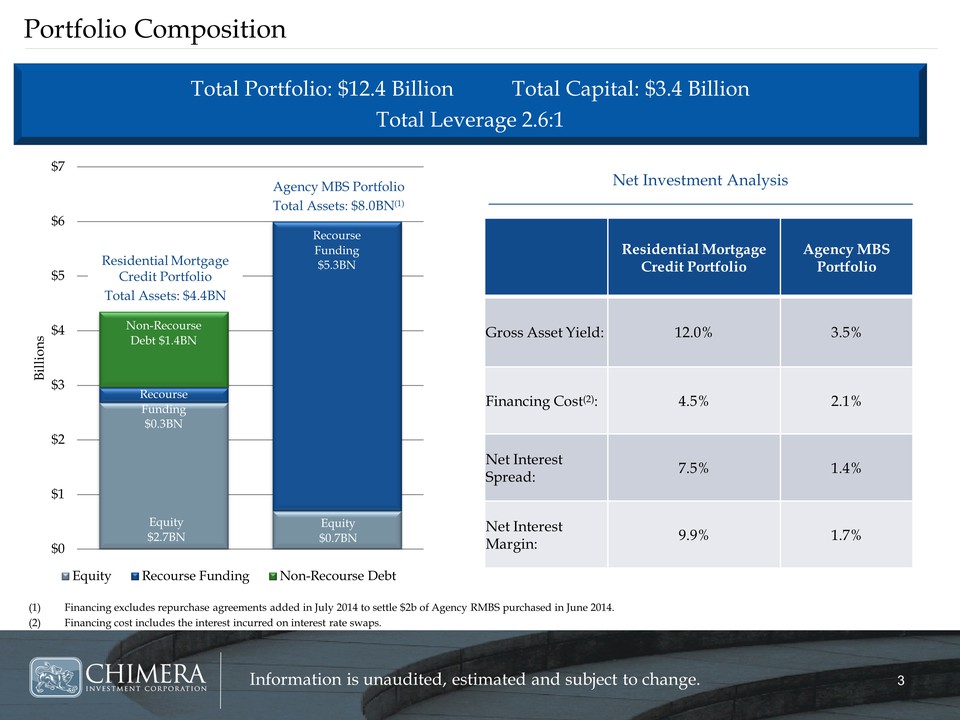
Portfolio Composition Total Portfolio: $12.4 Billion Total Capital: $3.4 Billion Total Leverage 2.6:1 $0 $1 $2 $3 $4 $5 $6 $7 Billions Equity Recourse Funding Non-Recourse Debt Residential Mortgage Credit Portfolio Total Assets: $4.4BN Agency MBS Portfolio Total Assets: $8.0BN(1) Equity $2.7BN Recourse Funding $0.3BN Non-Recourse Debt $1.4BN Equity $0.7BN Recourse Funding $5.3BN Net Investment Analysis Residential Mortgage Credit Portfolio Agency MBS Portfolio Gross Asset Yield: 12.0% 3.5% Financing Cost(2): 4.5% 2.1% Net Interest Spread: 7.5% 1.4% Net Interest Margin: 9.9% 1.7% (1) Financing excludes repurchase agreements added in July 2014 to settle $2b of Agency RMBS purchased in June 2014. (2) Financing cost includes the interest incurred on interest rate swaps. 3
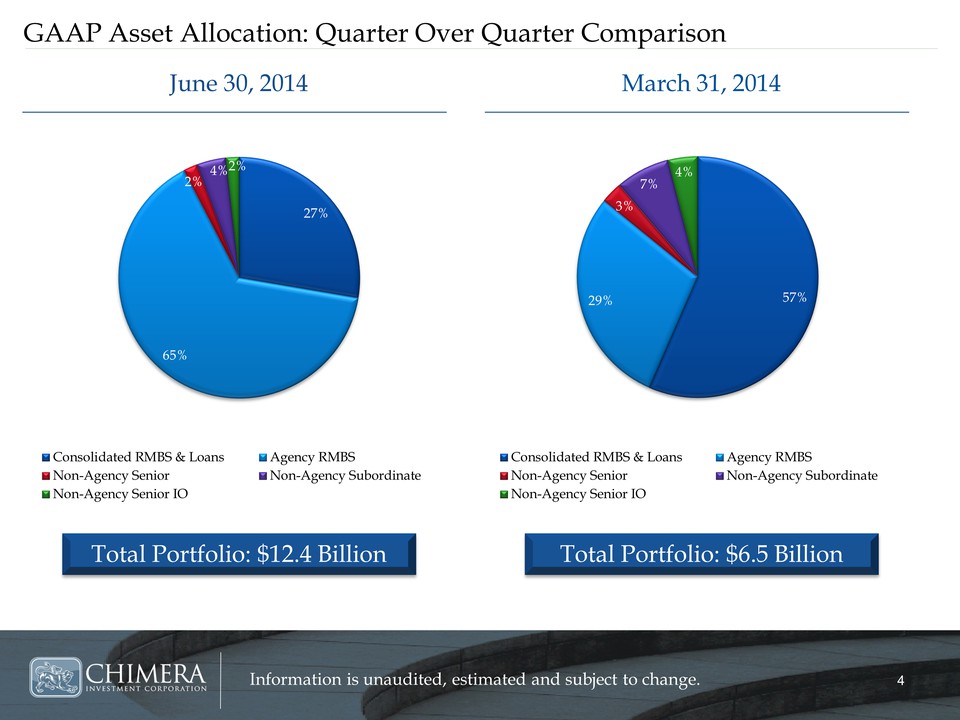
GAAP Asset Allocation: Quarter Over Quarter Comparison June 30, 2014 27% 65% 2% 4% 2% Consolidated RMBS & Loans Agency RMBS Non-Agency Senior Non-Agency Subordinate Non-Agency Senior IO Total Portfolio: $12.4 Billion March 31, 2014 57% 29% 3% 7% 4% Consolidated RMBS & Loans Agency RMBS Non-Agency Senior Non-Agency Subordinate Non-Agency Senior IO Total Portfolio: $6.5 Billion 4
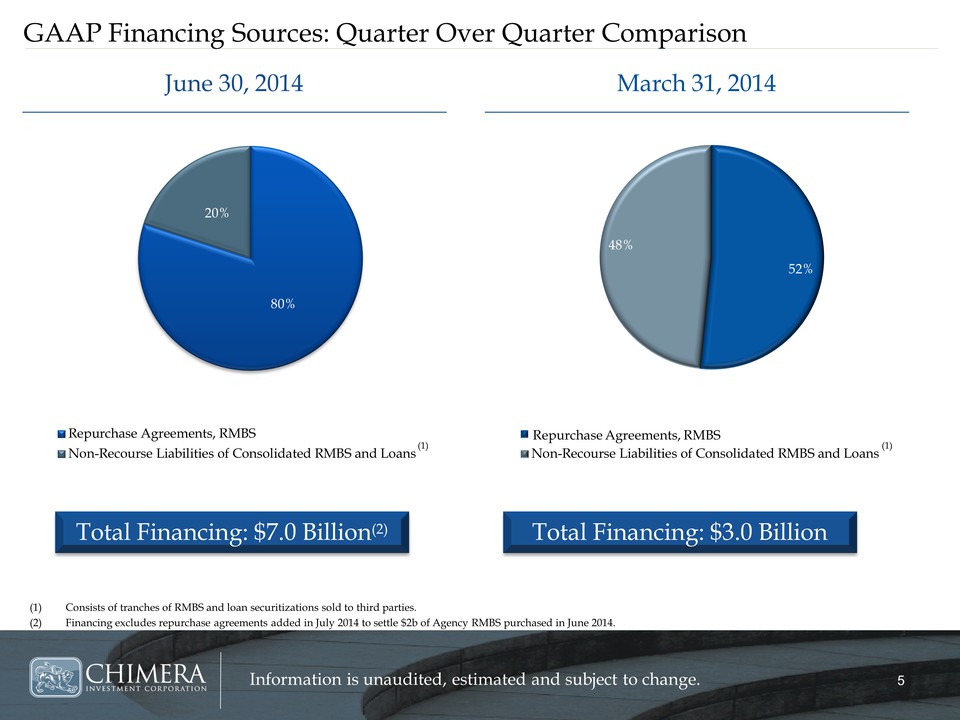
GAAP Financing Sources: Quarter Over Quarter Comparison June 30, 2014 80% 20% Repurchase Agreements, RMBS Non-Recourse Liabilities of Consolidated RMBS and Loans (1) Total Financing: $7.0 Billion(2) March 31, 2014 52% 48% Repurchase Agreements, RMBS Non-Recourse Liabilities of Consolidated RMBS and Loans (1) Total Financing: $3.0 Billion (1) Consists of tranches of RMBS and loan securitizations sold to third parties. (2) Financing excludes repurchase agreements added in July 2014 to settle $2b of Agency RMBS purchased in June 2014. 5
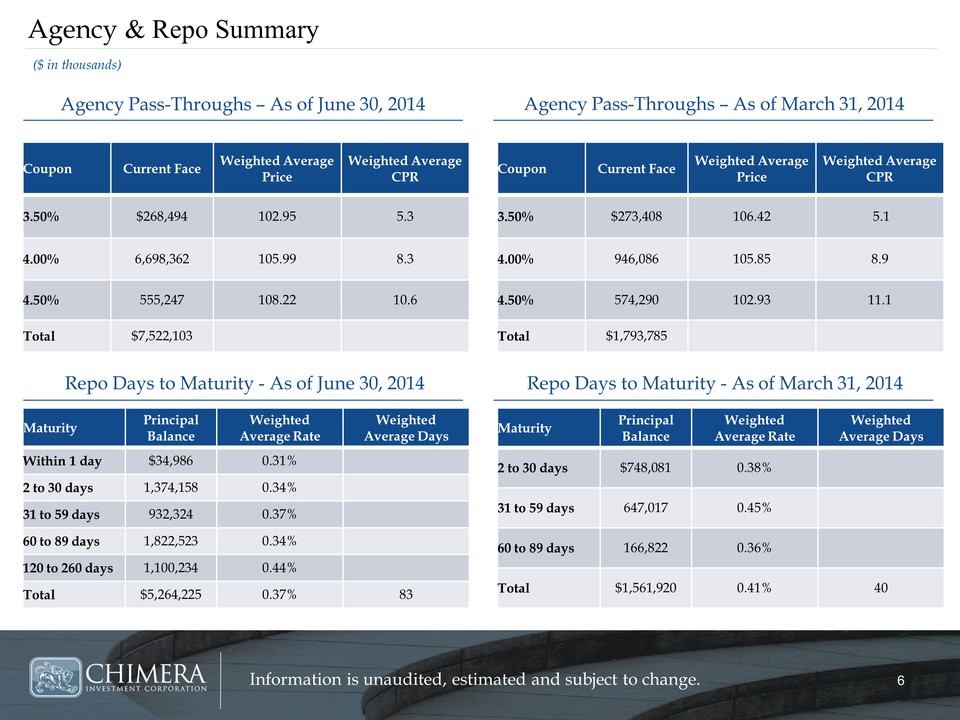
Agency & Repo Summary ($ in thousands) Agency Pass-Throughs – As of June 30, 2014 Coupon Current Face Weighted Average Price Weighted Average CPR 3.50% $268,494 102.95 5.3 4.00% 6,698,362 105.99 8.3 4.50% 555,247 108.22 10.6 Total $7,522,103 Repo Days to Maturity - As of June 30, 2014 Maturity Principal Balance Weighted Average Rate Weighted Average Days Within 1 day $34,986 0.31% 2 to 30 days 1,374,158 0.34% 31 to 59 days 932,324 0.37% 60 to 89 days 1,822,523 0.34% 120 to 260 days 1,100,234 0.44% Total $5,264,225 0.37% 83 Agency Pass-Throughs – As of March 31, 2014 Coupon Current Face Weighted Average Price Weighted Average CPR 3.50% $273,408 106.42 5.1 4.00% 946,086 105.85 8.9 4.50% 574,290 102.93 11.1 Total $1,793,785 Repo Days to Maturity - As of March 31, 2014 Maturity Principal Balance Weighted Average Rate Weighted Average Days 2 to 30 days $748,081 0.38% 31 to 59 days 647,017 0.45% 60 to 89 days 166,822 0.36% Total $1,561,920 0.41% 40 6
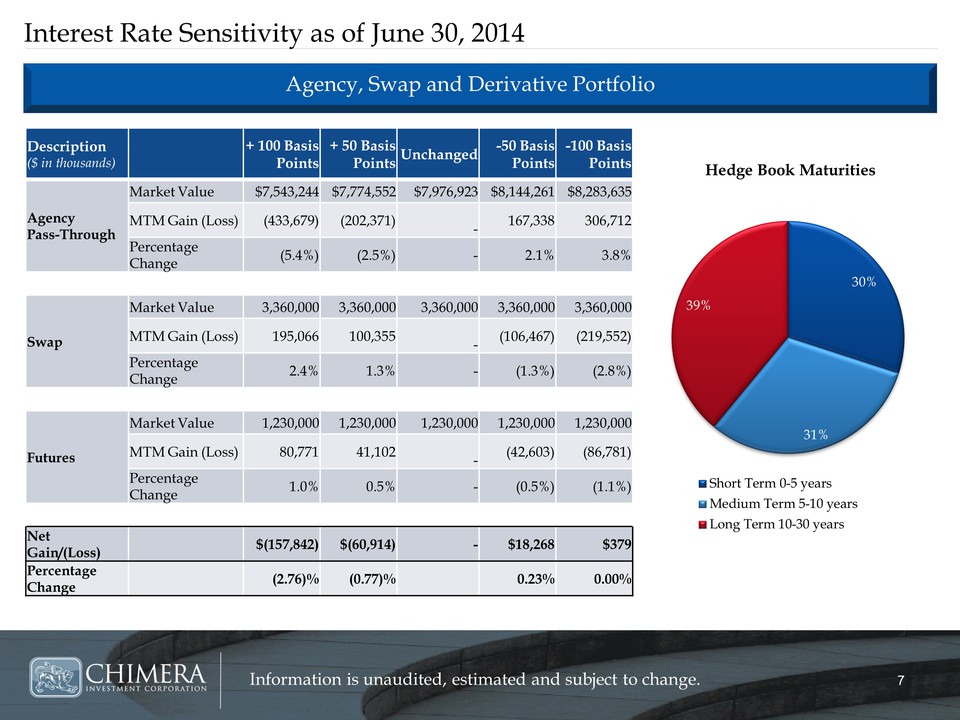
Interest Rate Sensitivity as of June 30, 2014 Agency, Swap and Derivative Portfolio Hedge Book Maturities 30% 31% 39% Short Term 0-5 years Medium Term 5-10 years Long Term 10-30 years Description ($ in thousands) + 100 Basis Points + 50 Basis Points Unchanged -50 Basis Points -100 Basis Points Agency Pass-Through Market Value $7,543,244 $7,774,552 $7,976,923 $8,144,261 $8,283,635 MTM Gain (Loss) (433,679) (202,371) - 167,338 306,712 Percentage Change (5.4%) (2.5%) - 2.1% 3.8% Swap Market Value 3,360,000 3,360,000 3,360,000 3,360,000 3,360,000 MTM Gain (Loss) 195,066 100,355 - (106,467) (219,552) Percentage Change 2.4% 1.3% - (1.3%) (2.8%) Futures Market Value 1,230,000 1,230,000 1,230,000 1,230,000 1,230,000 MTM Gain (Loss) 80,771 41,102 - (42,603) (86,781) Percentage Change 1.0% 0.5% - (0.5%) (1.1%) Net Gain/(Loss) $(157,842) $(60,914) - $18,268 $379 Percentage Change (2.76)% (0.77)% 0.23% 0.00% 7
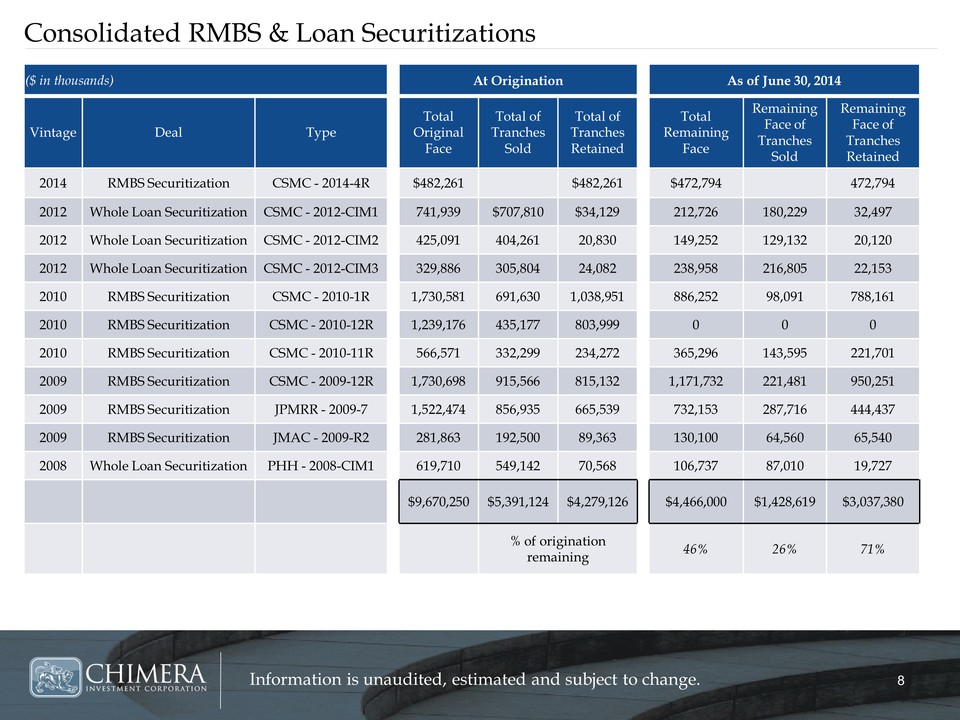
Consolidated RMBS & Loan Securitizations ($ in thousands) At Origination As of June 30, 2014 Vintage Deal Type Total Original Face Total of Tranches Sold Total of Tranches Retained Total Remaining Face Remaining Face of Tranches Sold Remaining Face of Tranches Retained 2014 RMBS Securitization CSMC - 2014-4R $482,261 $482,261 $472,794 472,794 2012 Whole Loan Securitization CSMC - 2012-CIM1 741,939 $707,810 $34,129 212,726 180,229 32,497 2012 Whole Loan Securitization CSMC - 2012-CIM2 425,091 404,261 20,830 149,252 129,132 20,120 2012 Whole Loan Securitization CSMC - 2012-CIM3 329,886 305,804 24,082 238,958 216,805 22,153 2010 RMBS Securitization CSMC - 2010-1R 1,730,581 691,630 1,038,951 886,252 98,091 788,161 2010 RMBS Securitization CSMC - 2010-12R 1,239,176 435,177 803,999 0 0 0 2010 RMBS Securitization CSMC - 2010-11R 566,571 332,299 234,272 365,296 143,595 221,701 2009 RMBS Securitization CSMC - 2009-12R 1,730,698 915,566 815,132 1,171,732 221,481 950,251 2009 RMBS Securitization JPMRR - 2009-7 1,522,474 856,935 665,539 732,153 287,716 444,437 2009 RMBS Securitization JMAC - 2009-R2 281,863 192,500 89,363 130,100 64,560 65,540 2008 Whole Loan Securitization PHH - 2008-CIM1 619,710 549,142 70,568 106,737 87,010 19,727 $9,670,250 $5,391,124 $4,279,126 $4,466,000 $1,428,619 $3,037,380 % of origination remaining 46% 26% 71% 8