EXHIBIT 99.2
Published on November 3, 2015
Exhibit 99.2
Q3 2015 Supplemental Financial Information November 4, 2015
Disclaimer This material is not intended to be exhaustive, is preliminary in nature and may be subject to change. In addition, much of the information contained herein is based on various assumptions (some of which are beyond the control of Chimera Investment Corporation, the “Company”) and may be identified by reference to a future period or periods or by the use of forward-looking terminology, such as “believe,” “expect,” “anticipate,” “estimate,” “plan,” “continue,” “intend,” “should,” “may,” “would,” “projected,” “will” or similar expressions, or variations on those terms or the negative of those terms. The Company’s forward-looking statements are subject to numerous risks, uncertainties and other factors. Furthermore, none of the financial information contained in this material has been audited or approved by the Company’s independent registered public accounting firm.
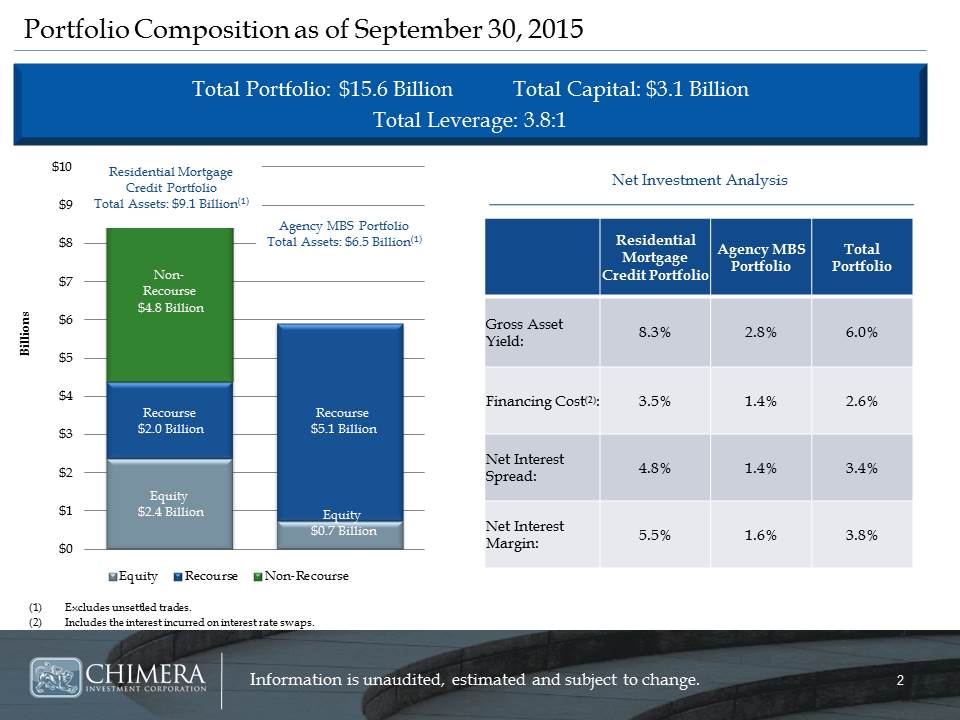
Portfolio Composition as of September 30, 2015 : Excludes unsettled trades. Includes the interest incurred on interest rate swaps. : Total Portfolio: $15.6 Billion Total Capital: $3.1 Billion Total Leverage: 3.8:1 Net Investment Analysis Agency MBS Portfolio Total Assets: $6.5 Billion(1) Residential Mortgage Credit Portfolio Total Assets: $9.1 Billion(1)
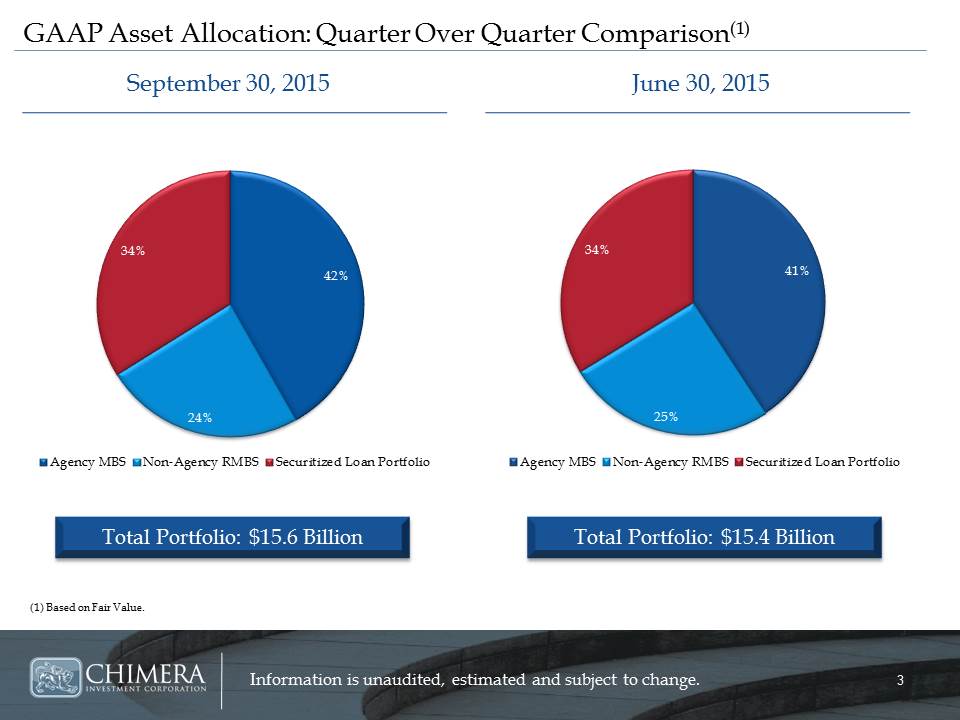
September 30, 2015 : June 30, 2015 : GAAP Asset Allocation: Quarter Over Quarter Comparison(1) : (1) Based on Fair Value. Total Portfolio: $15.4 Billion
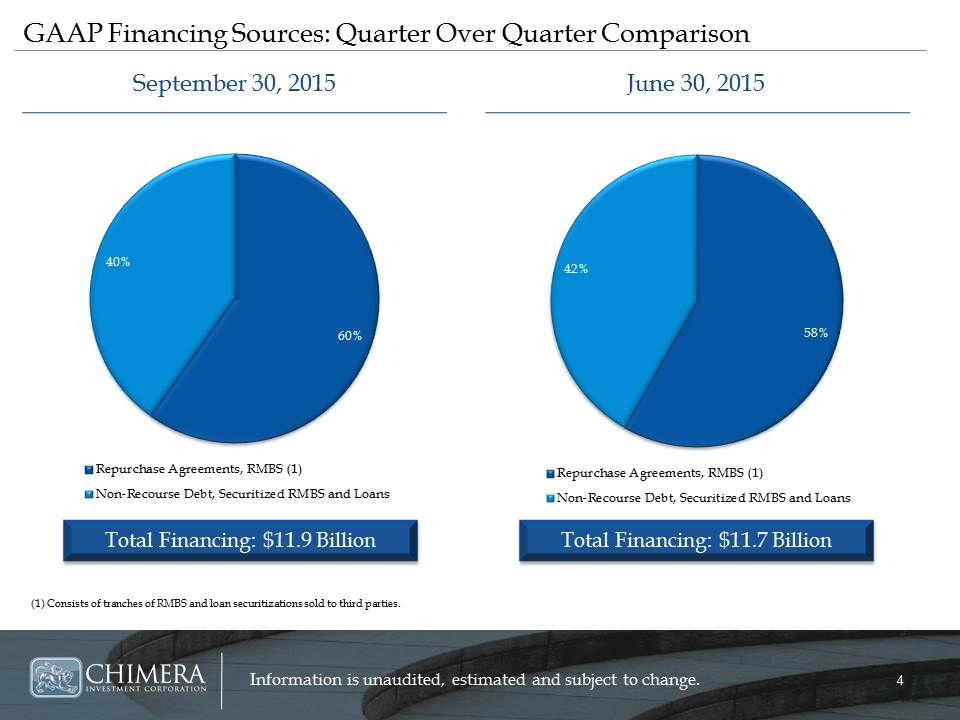
(1) Consists of tranches of RMBS and loan securitizations sold to third parties. : September 30, 2015 : June 30, 2015 : GAAP Financing Sources: Quarter Over Quarter Comparison Total Financing: $11.9 Billion Total Financing: $11.7 Billion
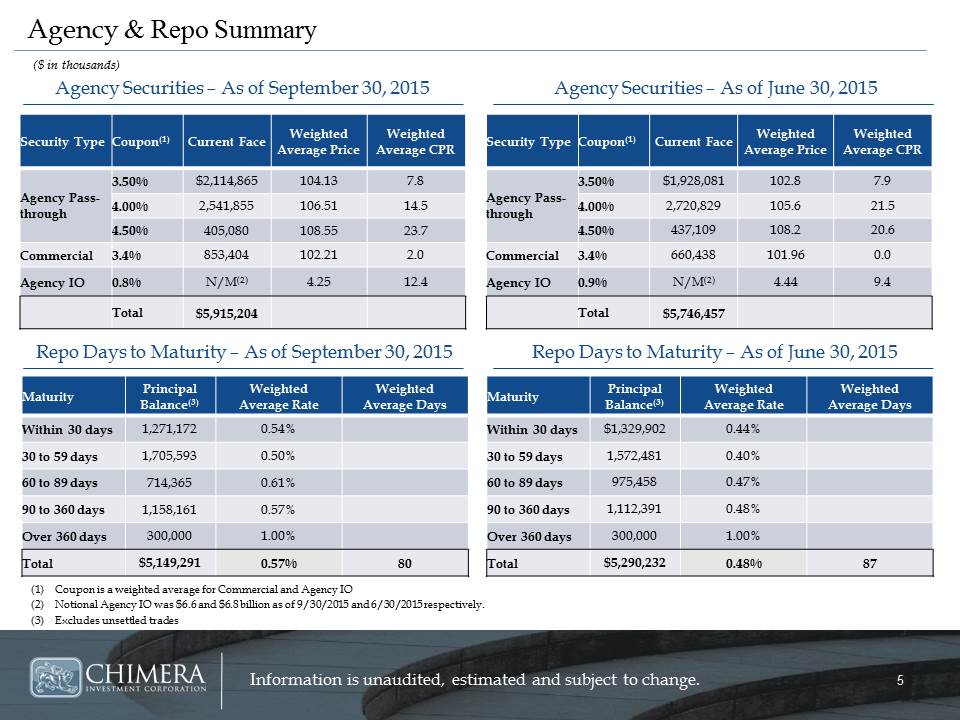
Agency & Repo Summary Agency Securities – As of September 30, 2015 Repo Days to Maturity – As of September 30, 2015 Agency Securities – As of June 30, 2015 Repo Days to Maturity – As of June 30, 2015 : ($ in thousands) : Coupon is a weighted average for Commercial and Agency IO Notional Agency IO was $6.6 and $6.8 million as of 9/30/2015 and 6/30/2015 respectively. Excludes unsettled trades
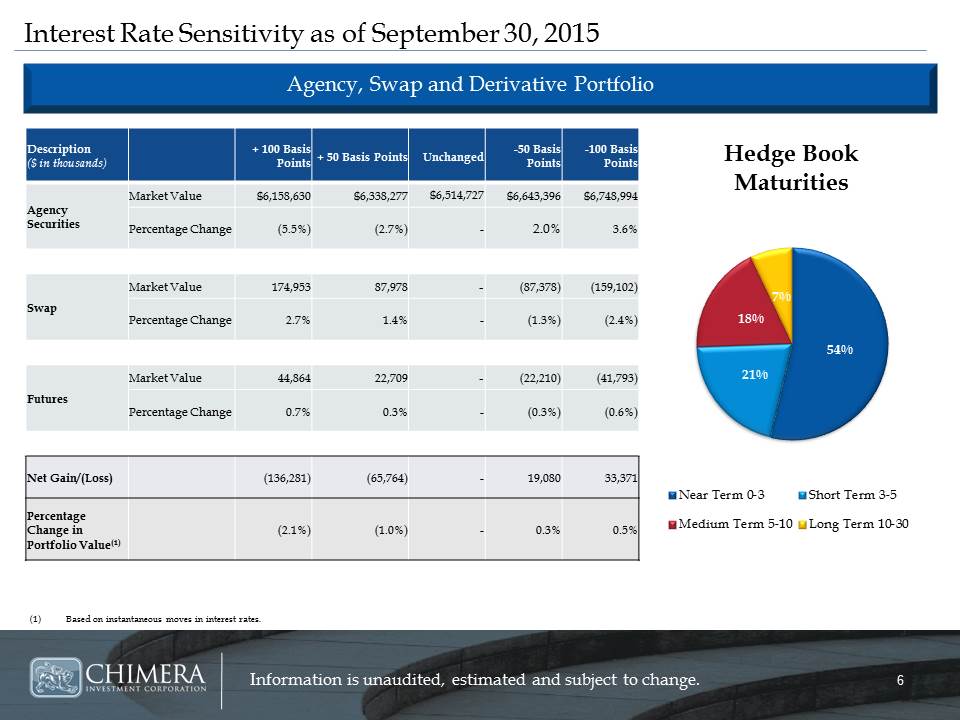
Interest Rate Sensitivity as of September 30, 2015 : Agency, Swap and Derivative Portfolio : Based on instantaneous moves in interest rates.
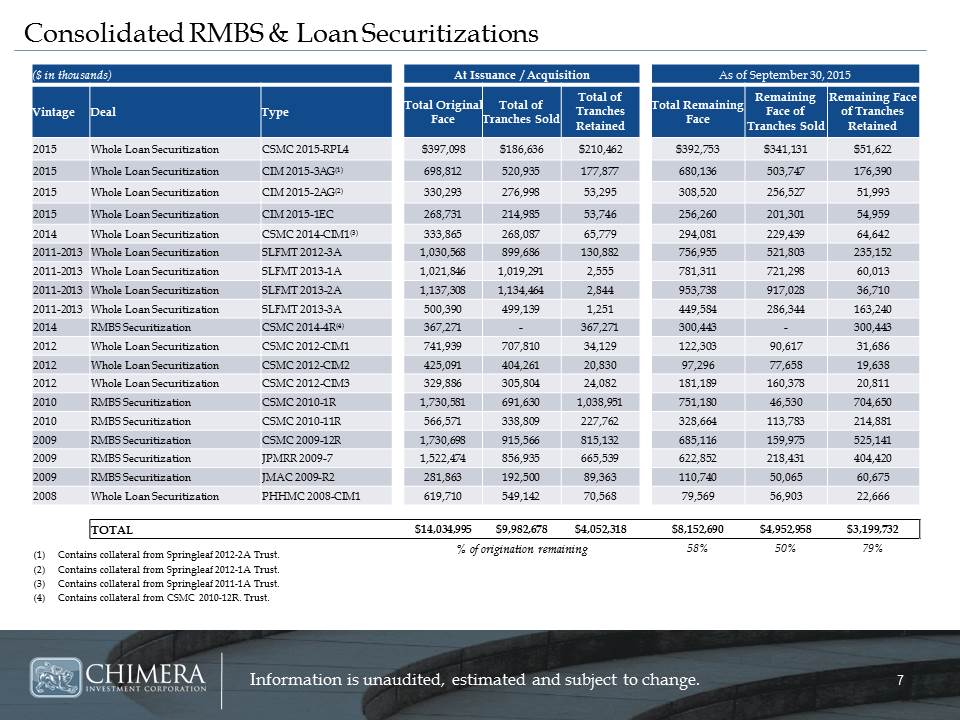
Consolidated RMBS & Loan Securitizations : Contains collateral from Springleaf 2012-2A Trust. Contains collateral from Springleaf 2012-1A Trust. Contains collateral from Springleaf 2011-1A Trust. Contains collateral from CSMC 2010-12R. Trust. ($ in thousands) At Issuance / Acquisition As of September 30, 2015 Vintage Deal Type Total Original Face Total of Tranches Sold Total of Tranches Retained Total Remaining Face Remaining Face of Tranches Sold Remaining Face of Tranches Retained 2015 Whole Loan Securitization CSMC 2015-RPL4 $397,098 $186,636 $210,462 $392,753 $341,131 $51,622 2015 Whole Loan Securitization CIM 2015-3AG(1) 698,812 520,935 177,877 680,136 503,747 176,390 2015 Whole Loan Securitization CIM 2015-2AG(2) 330,293 276,998 53,295 308,520 256,527 51,993 2015 Whole Loan Securitization CIM 2015-1EC 268,731 214,985 53,746 256,260 201,301 54,959 2014 Whole Loan Securitization CSMC 2014-CIM1(3) 333,865 268,087 65,779 294,081 229,439 64,642 2011-2013 Whole Loan Securitization SLFMT 2012-3A 1,030,568 899,686 130,882 756,955 521,803 235,152 2011-2013 Whole Loan Securitization SLFMT 2013-1A 1,021,846 1,019,291 2,555 781,311 721,298 60,013 2011-2013 Whole Loan Securitization SLFMT 2013-2A 1,137,308 1,134,464 2,844 953,738 917,028 36,710 2011-2013 Whole Loan Securitization SLFMT 2013-3A 500,390 499,139 1,251 449,584 286,344 163,240 2014 RMBS Securitization CSMC 2014-4R(4) 367,271 - 367,271 300,443 - 300,443 2012 Whole Loan Securitization CSMC 2012-CIM1 741,939 707,810 34,129 122,303 90,617 31,686 2012 Whole Loan Securitization CSMC 2012-CIM2 425,091 404,261 20,830 97,296 77,658 19,638 2012 Whole Loan Securitization CSMC 2012-CIM3 329,886 305,804 24,082 181,189 160,378 20,811 2010 RMBS Securitization CSMC 2010-1R 1,730,581 691,630 1,038,951 751,180 46,530 704,650 2010 RMBS Securitization CSMC 2010-11R 566,571 338,809 227,762 328,664 113,783 214,881 2009 RMBS Securitization CSMC 2009-12R 1,730,698 915,566 815,132 685,116 159,975 525,141 2009 RMBS Securitization JPMRR 2009-7 1,522,474 856,935 665,539 622,852 218,431 404,420 2009 RMBS Securitization JMAC 2009-R2 281,863 192,500 89,363 110,740 50,065 60,675 2008 Whole Loan Securitization PHHMC 2008-CIM1 619,710 549,142 70,568 79,569 56,903 22,666 TOTAL $14,034,995 $9,982,678 $4,052,318 $8,152,690 $4,952,958 $3,199,732 % of origination remaining 58% 50% 79%
Q3 2015 Supplemental Financial Information