EXHIBIT 99.1
Published on November 12, 2015
Exhibit 99.1

WWW.CHIMERAREIT.COM Investor Presentation | Third Quarter 2015 November 2015 CONFERENCE
Disclaimer
This material is not intended to be exhaustive, is preliminary in nature and may be subject to change. In addition, much of the information contained herein is based on various assumptions (some of which are beyond the control of Chimera Investment Corporation, the “Company”) and may be identified by reference to a future period or periods or by the use of forward-looking terminology, such as “believe,” “expect,” “anticipate,” “estimate,” “plan,” “continue,” “intend,” “should,” “may,” “would,” “projected,” “tends,” “will” or similar expressions, or variations on those terms or the negative of those terms. The Company’s forward-looking statements are subject to numerous risks, uncertainties and other factors. You should review some of these factors that are described under the caption “Risk Factors” in our 2014 Form 10-K. Any forward-looking statement speaks only as of the date on which it is made. New risks and uncertainties arise from time to time, and it is impossible for us to predict those events or how they may affect us. Except as required by law, we are not obligated to, and do not intend to, update or revise any forward-looking statements, whether as a result of new information, future events or otherwise. Furthermore, none of the financial information contained in this material has been audited or approved by the Company’s independent registered public accounting firm. Information is unaudited, estimated and subject to change.
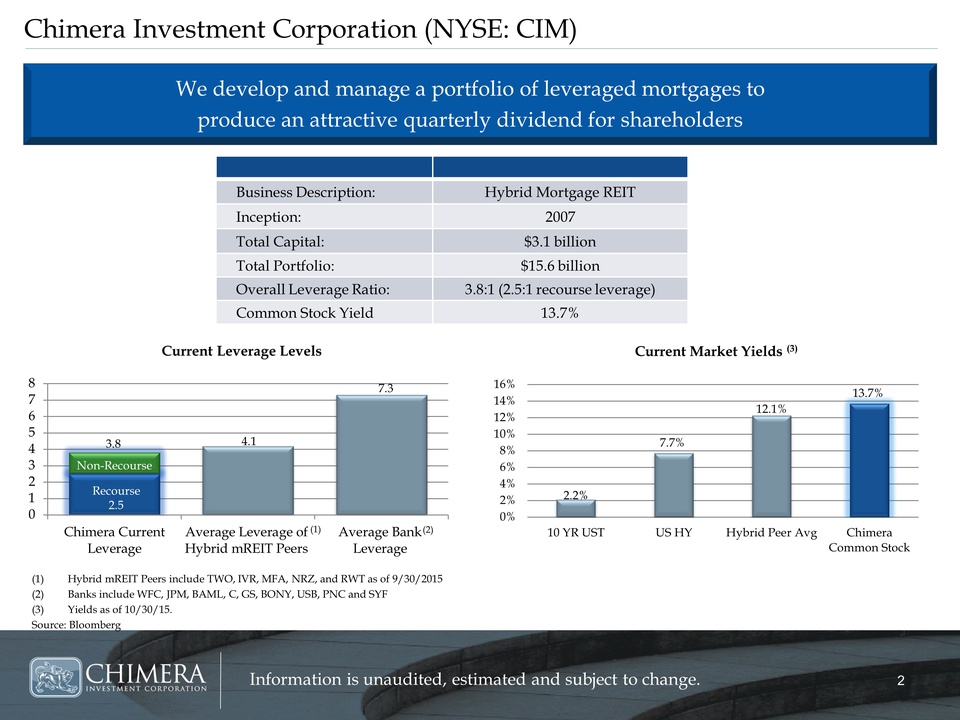
Chimera Investment Corporation (NYSE: CIM) (1)Hybrid mREIT Peers include TWO, IVR, MFA, NRZ, and RWT as of 9/30/2015 (2)Banks include WFC, JPM, BAML, C, GS, BONY, USB, PNC and SYF
(3)Yields as of 10/30/15. Source: Bloomberg Business Description: Hybrid Mortgage REIT Inception: 2007 Total Capital: $3.1 billion Total Portfolio: $15.6 billion Overall Leverage Ratio: 3.8:1 (2.5:1 recourse leverage)
Common Stock Yield 13.7% Current Leverage Levels Current Market Yields (3) We develop and manage a portfolio of Chimera Current Leverage Average Leverage of Hybrid mREIT Peers Average Bank
Leverage 10 YR UST US HY Hybrid Peer Avg Chimera Common Stock
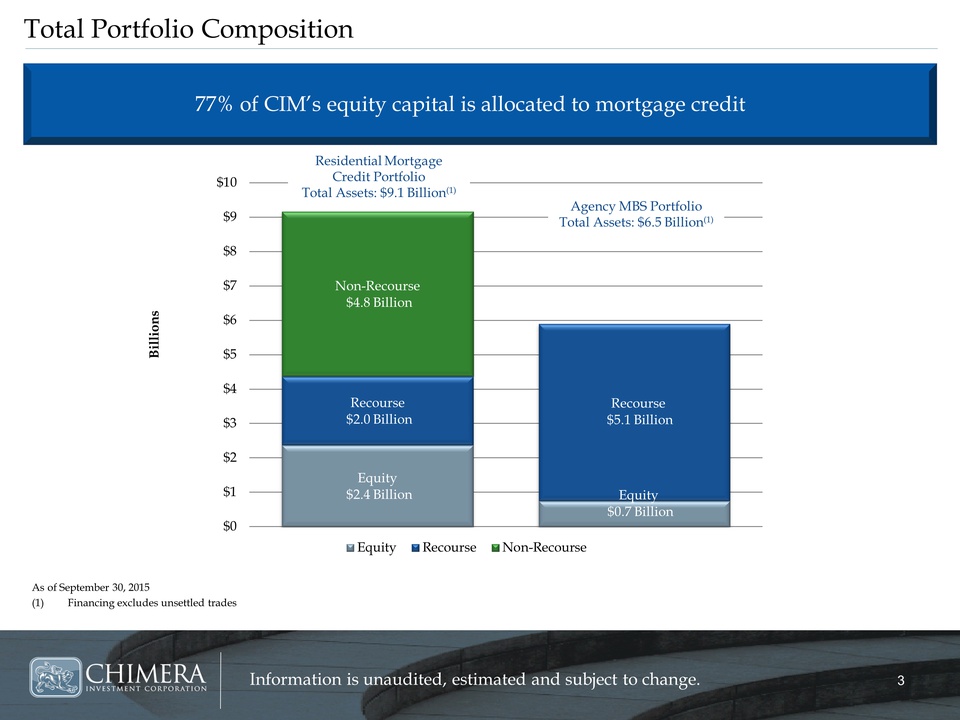
Total Portfolio Composition As of September 30, 2015 (1)Financing excludes unsettled trades Residential Mortgage Credit Portfolio Total Assets: $9.1 Billion(1) Agency MBS Portfolio Total Assets: $6.5 Billion 77% of CIM’s equity capital is allocated to Equity Recourse Non-Recoursemortgage credit Equity $2.4 Billion Equity $0.7 Billion
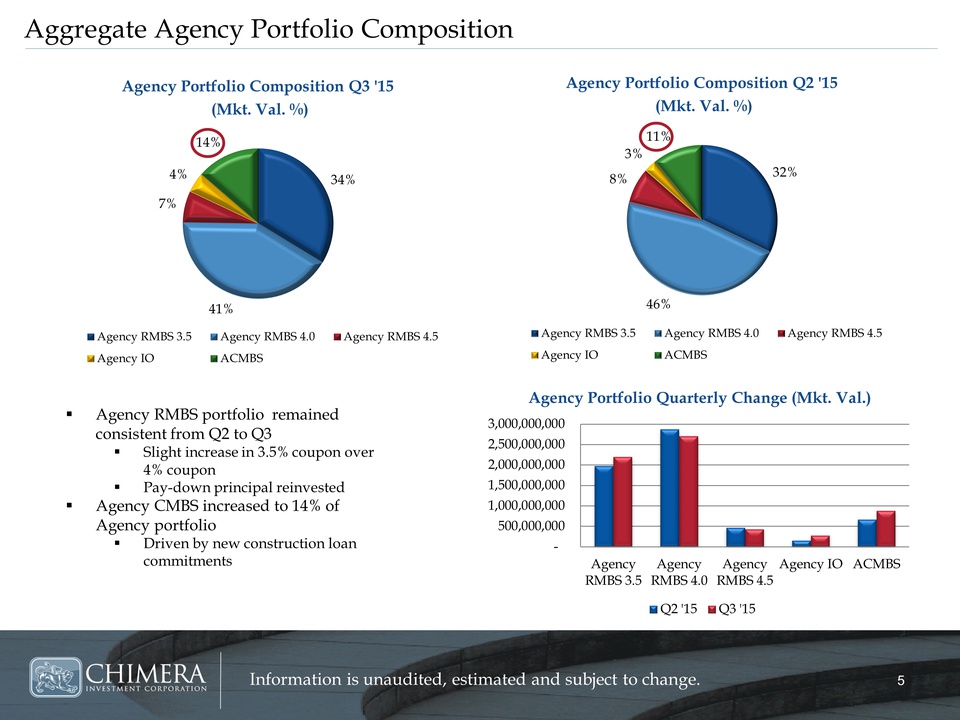
Aggregate Agency Portfolio Composition 32% 46% 8% 3% 11% Agency Portfolio Composition Q2 '15 (Mkt. Val. %)Agency RMBS portfolio remained consistent from Q2 to Q3 Slight increase in 3.5% coupon over 4% coupon
Pay-down principal reinvested Agency CMBS increased to 14% of Agency portfolio Driven by new construction loan commitments 3,000,000,000 2,500,000,000 2,000,000,000 1,500,000,000 1,000,000,000 500,000,000
Agency RMBS 3.5Agency RMBS 4.0Agency RMBS 4.5Agency IO ACMBS
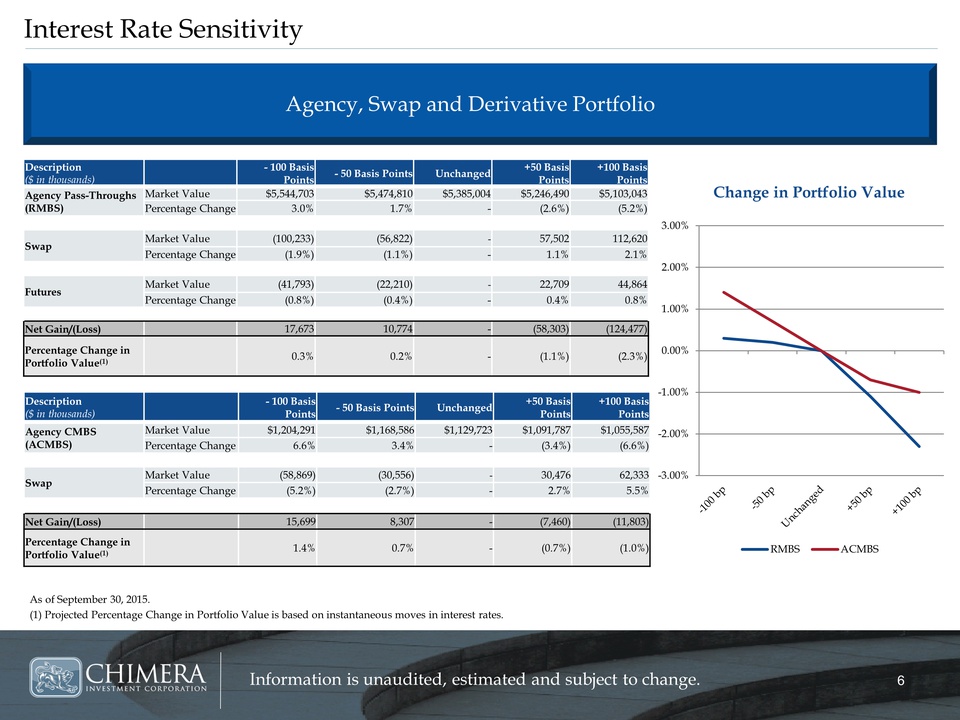
Interest Rate SensitivityAgency, Swap and Derivative Portfolio Description ($ in thousands
As of September 30, 2015(1) Projected Percentage Change in Portfolio Value is based on instantaneous moves in interest rates.Change in Portfolio Value
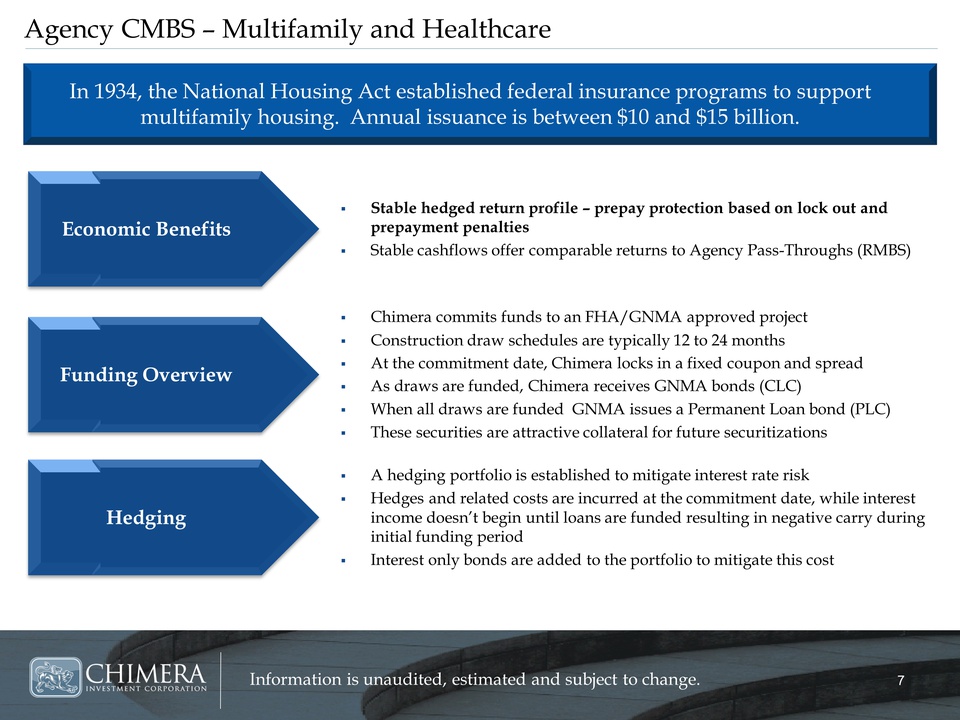
Agency CMBS Multifamily and Healthcare In 1934, the National Housing Act established federal insurance programs to support multifamily housing. Annual issuance is between $10 and $15 billion. Stable hedged return profile prepay protection based on lock out and prepayment penalties Stable cashflows offer comparable returns to Agency Pass-Throughs (RMBS)Economic Benefits Chimera commits funds to an FHA/GNMA approved project Construction draw schedules are typically 12 to 24 months At the commitment date, Chimera locks in a fixed coupon and spread As draws are funded, Chimera receives GNMA bonds (CLC) When all draws are funded GNMA issues a Permanent Loan bond (PLC) These securities are attractive collateral for future securitizationsA hedging portfolio is established to mitigate interest rate risk ?Hedges and related costs are incurred at the commitment date, while interest income doesnt begin until loans are funded resulting in negative carry during initial funding period ?Interest only bonds are added to the portfolio to mitigate this cost
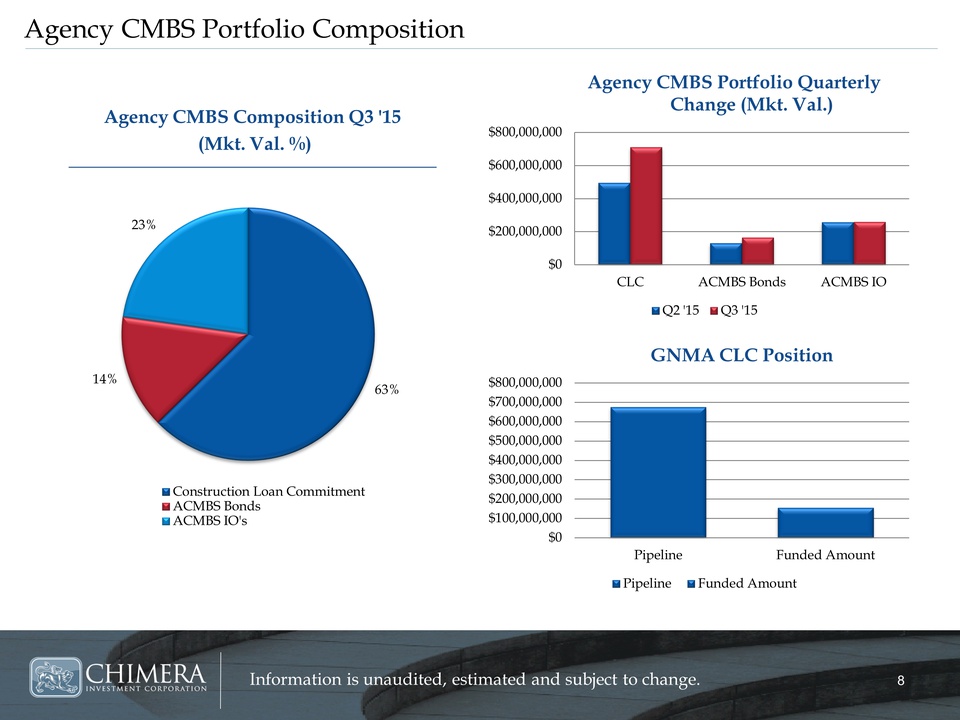
Agency CMBS Portfolio Composition 63% 14% 23% Construction Loan Commitment ACMBS Bonds ACMBS IO's $0 $200,000,000 $400,000,000 $600,000,000 $800,000,000 CLC ACMBS Bonds ACMBS IO Agency CMBS Portfolio Quarterly Change (Mkt. Val.) Q2 '15 Q3 '15 $0 $100,000,000 $200,000,000 $300,000,000 $400,000,000 $500,000,000 $600,000,000 $700,000,000 $800,000,000 Pipeline Funded Amount GNMA CLC Position Pipeline Funded Amount Agency CMBS Composition
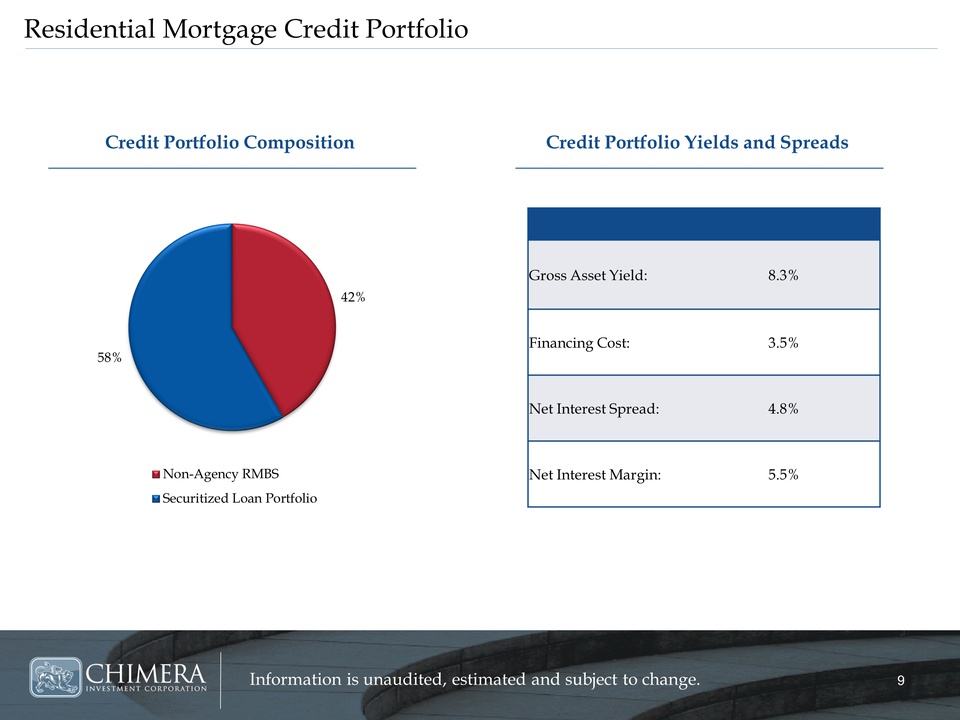
Residential Mortgage Credit Portfolio Credit Portfolio Composition Credit Portfolio Yields and Spreads Gross Asset Yield: 8.3% Financing Cost: 3.5% Net Interest Spread: 4.8% Net Interest Margin: 5.5%
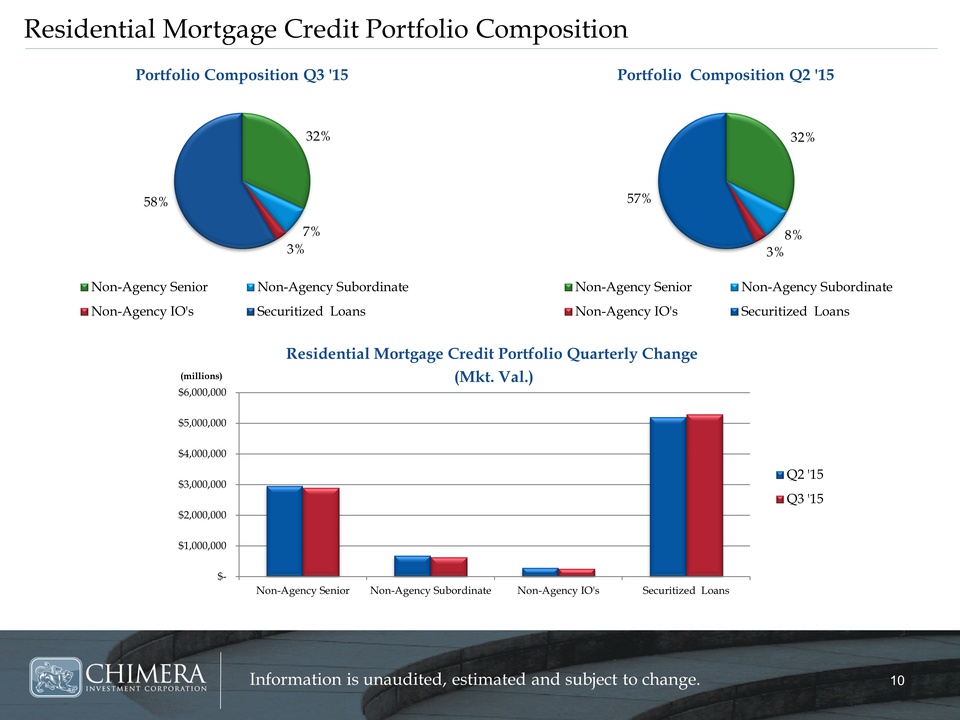
Residential Mortgage Credit Portfolio Composition 32% 8% 3% 57% Portfolio Composition Q2 '15 Non-Agency Senior Non-Agency Subordinate Non-Agency IO's Securitized Loans 32% 7% 3% 58% Portfolio Composition Q3 '15 Non-Agency Senior Non-Agency Subordinate Non-Agency IO's Securitized Loans $- $1,000,000 $2,000,000 $3,000,000 $4,000,000 $5,000,000 $6,000,000 Non-Agency Senior Non-Agency Subordinate Non-Agency IO's Securitized Loans (millions) Residential Mortgage Credit Portfolio Quarterly Change
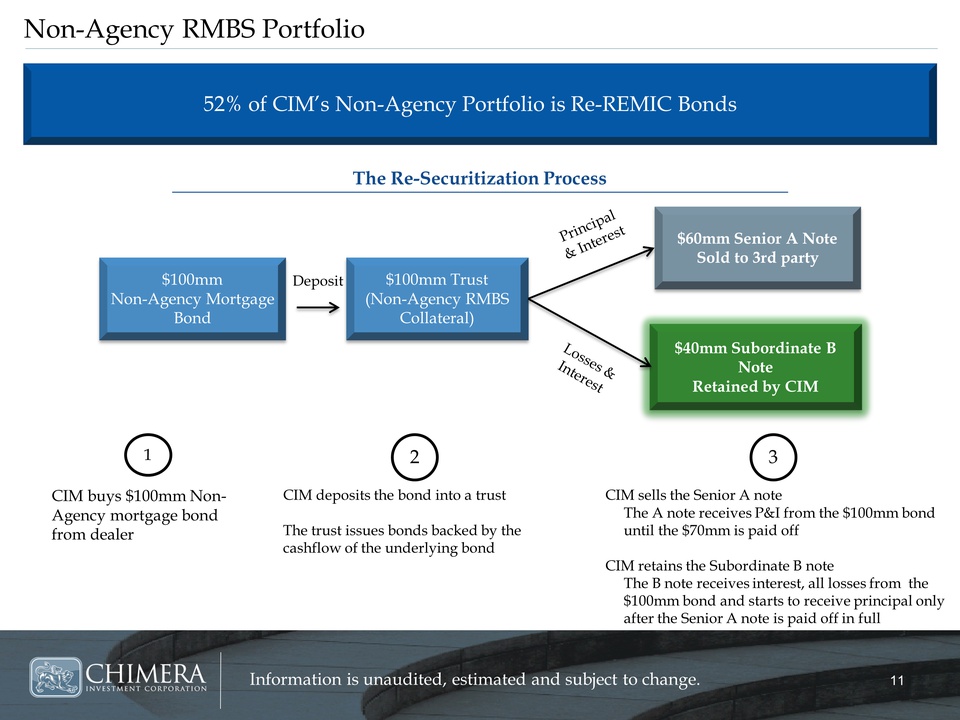
Non-Agency RMBS Portfolio 52% of CIMs Non-Agency Portfolio is Re-REMIC Bonds The Re-Securitization Process $40mm Subordinate B Note Retained by CIM $100mm Non-Agency Mortgage Bond $100mm Trust (Non-Agency RMBS Collateral) $60mm Senior A Note Sold to 3rd party Deposit CIM buys $100mm Non-Agency mortgage bond from dealer CIM deposits the bond into a trust The trust issues bonds backed by the cashflow of the underlying bond CIM sells the Senior A note The A note receives P&I from the $100mm bond until the $70mm is paid off CIM retains the Subordinate B note The B note receives interest, all losses from the $100mm bond and starts to receive principal only after the Senior A note is paid off in full
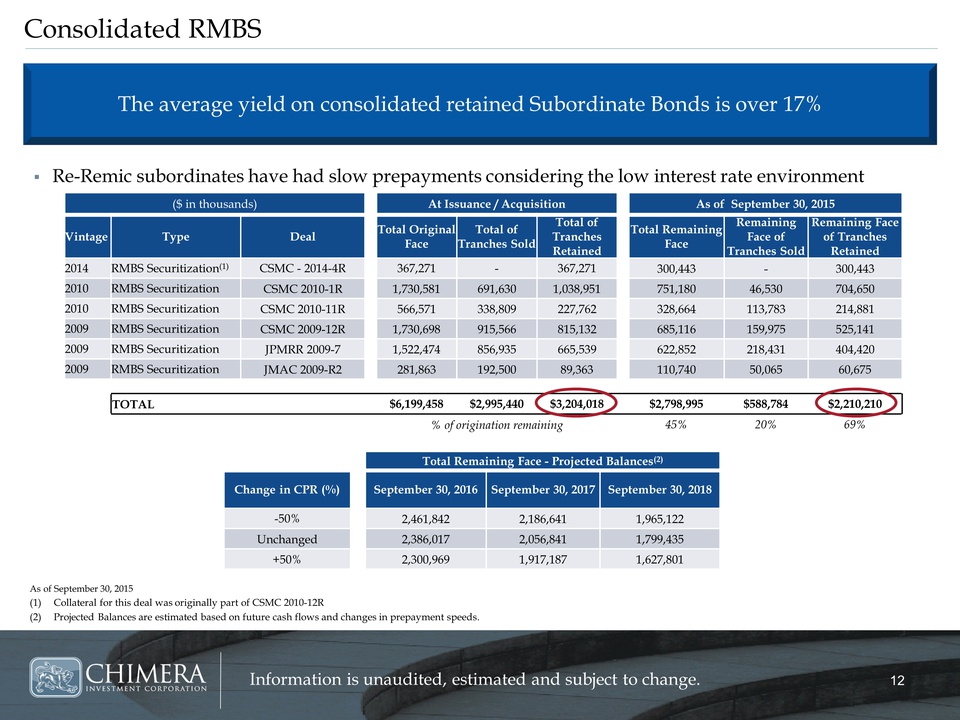
Consolidated RMBS As of September 30, 2015 (1)Collateral for this deal was originally part of CSMC 2010-12R (2)Projected Balances are estimated based on future cash flows and changes in prepayment speeds. Re-Remic subordinates have had slow prepayments considering the low interest rate environment
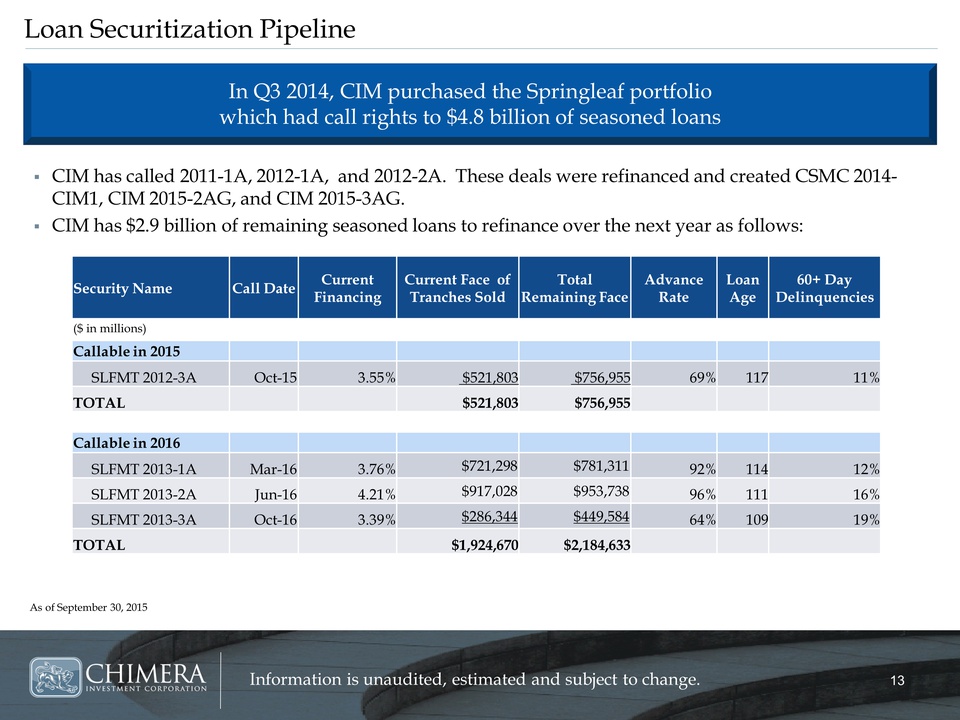
Loan Securitization Pipeline Callable in 2015 SLFMT 2012-3A Oct-15 3.55% $521,803 $756,955 69% 117 11% TOTAL $521,803 $756,955 Callable in 2016 SLFMT 2013-1A Mar-16 3.76% $721,298 $781,311 92% 114 12% SLFMT 2013-2A Jun-16 4.21% $917,028 $953,738 96% 111 16% SLFMT 2013-3A Oct-16 3.39% $286,344 $449,584 64% 109 19% TOTAL $1,924,670 $2,184,633 CONFERENCEN A M EGOESHERE1313 Information isun audit ed, estimated and subject to change. CIM has called 2011-1A, 2012-1A, and 2012-2A. These deals were refinanced and created CSMC 2014-CIM1, CIM 2015-2AG, and CIM 2015-3AG. CIM has $2.9 billion of remaining seasoned loans to refinance over the next year as follows: As of September 30, 2015
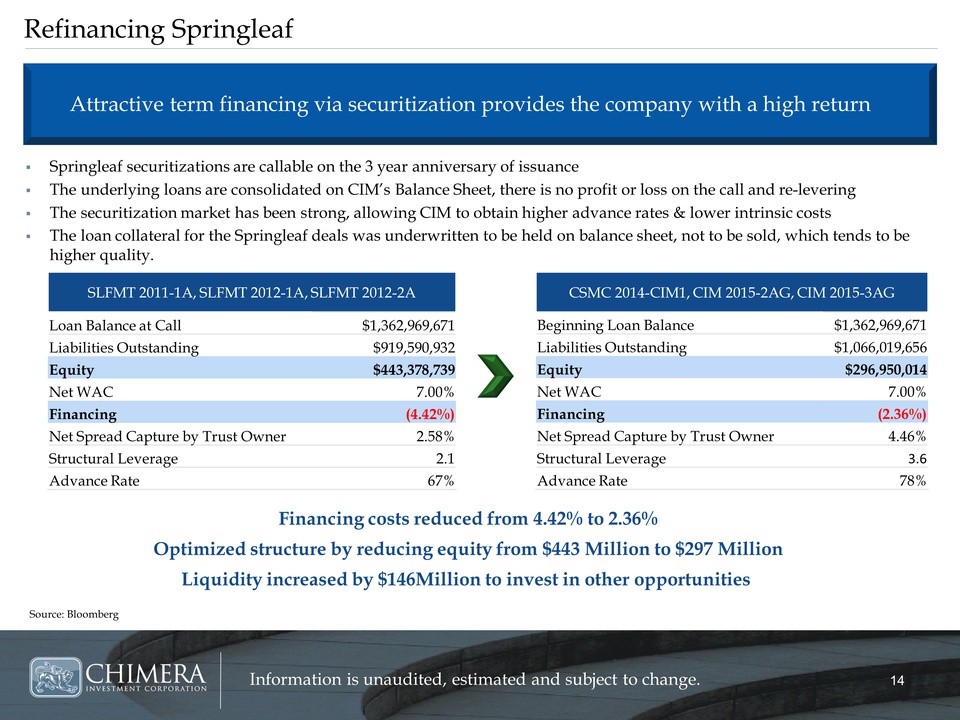
Refinancing Springleaf Attractive term financing via securitization provides the company with a high return Springleaf securitizations are callable on the 3 year anniversary of issuance The underlying loans are consolidated on CIMs Balance Sheet, there is no profit or loss on the call and re-levering The securitization market has been strong, allowing CIM to obtain higher advance rates & lower intrinsic costs [BEGIN TEXT BOX] CSMC 2014-CIM1, CIM 2015-2AG, CIM 2015-3AG Beginning Loan Balance $1,362,969,671 Liabilities Outstanding $1,066,019,656 Equity $296,950,014 Net WAC 7.00% Financing (2.36%) Net Spread Capture by Trust Owner 4.46% Structural Leverage 3.6 Advance Rate 78% The loan collateral for the Springleaf deals was underwritten to be held on balance sheet, not to be sold, which tends to be higher quality. SLFMT 2011-1A, SLFMT 2012-1A, SLFMT 2012-2A Loan Balance at Call $1,362,969,671 Liabilities Outstanding $919,590,932 Equity $443,378,739 Net WAC7.00% Financing (4.42%) Net Spread Capture by Trust Owner 2.58% Structural Leverage 2.1 Advance Rate 67% Financing costs reduced from 4.42% to 2.36% Optimized structure by reducing equity from $443 Million to $297 Million Liquidity increased by $146Million to invest in other opportunities
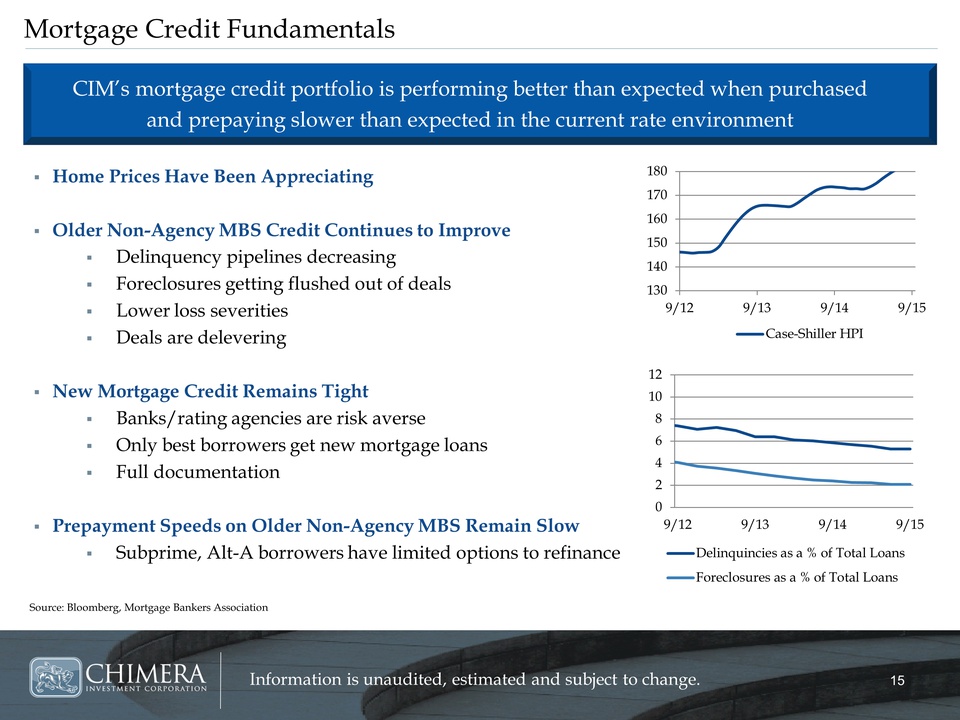
Mortgage Credit Fundamentals CIMs mortgage credit portfolio is performing better than expected when purchased and prepaying slower than expected in the current rate environment Home Prices Have Been Appreciating Older Non-Agency MBS Credit Continues to Improve Delinquency pipelines decreasing Foreclosures getting flushed out of deals Lower loss severities Deals are delevering New Mortgage Credit Remains Tight Banks/rating agencies are risk averse Only best borrowers get new mortgage loans Full documentation Prepayment Speeds on Older Non-Agency MBS Remain Slow Subprime, Alt-A borrowers have limited options to refinance 180 170 160 150 140 130 9/129/139/149/15 Case-Shiller HPI 12 10 8 6 4 2 0 9/129/139/149/15 Delinquincies as a % of Total Loans Foreclosures as a % of Total Loans Source: Bloomberg, Mortgage Bankers Association
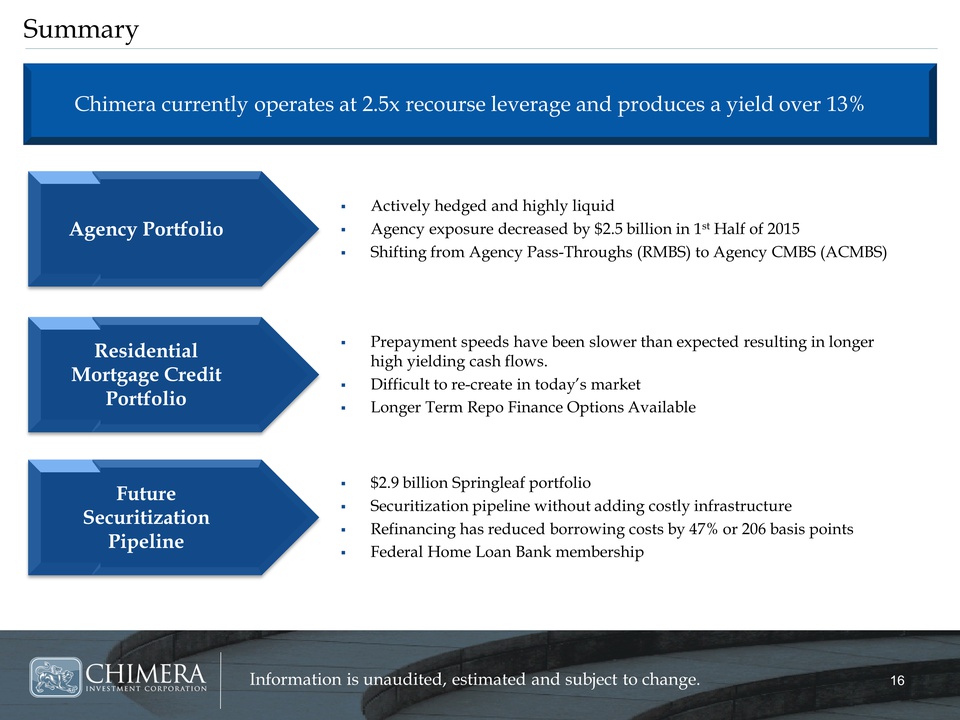
Summary Actively hedged and highly liquid Agency exposure decreased by $2.5 billion in 1st Half of 2015 Shifting from Agency Pass-Throughs (RMBS) to Agency CMBS (ACMBS) Prepayment speeds have been slower than expected resulting in longer high yielding cash flows. Difficult to re-create in todays market Longer Term Repo Finance Options Available $2.9 billion Springleaf portfolio Securitization pipeline without adding costly infrastructure Refinancing has reduced borrowing costs by 47% or 206 basis points Federal Home Loan Bank membership
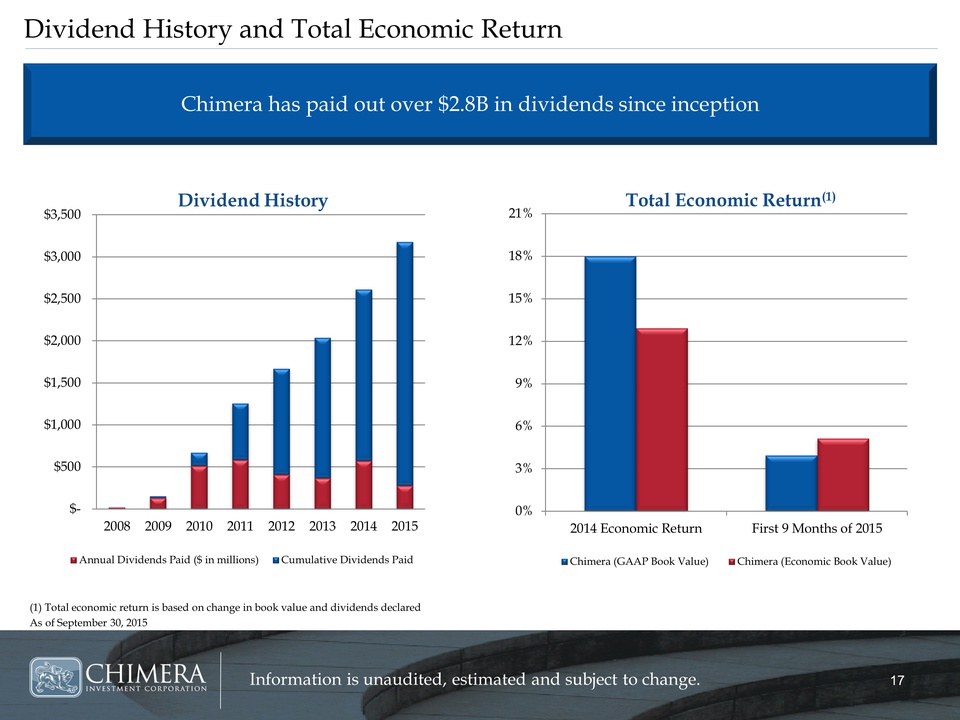
$3,500 Dividend HistoryTotal Economic Return(1) 21% $3,000 18% $2,500 15% $2,000 12% $1,5009% $1,0006% $5003% $- 20082009201020112012201320142015 0% 2014 Economic ReturnFirst 9 Months of 2015 Annual Dividends Paid ($ in millions)Cumulative Dividends Paid Chimera (GAAP Book Value)Chimera (Economic Book Value) (1) Total economic return is based on change in book value and dividends declared As of September 30, 2015