EXHIBIT 99.1
Published on March 8, 2016
Exhibit 99.1

Investor Presentation | Fourth Quarter 2015 March 2016
This material is not intended to be exhaustive, is preliminary in nature and may be subject to change. In addition, much of the information contained herein is based on various assumptions (some of which are beyond the control of Chimera Investment Corporation, the “Company”) and may be identified by reference to a future period or periods or by the use of forward-looking terminology, such as “believe,” “expect,” “anticipate,” “estimate,” “plan,” “continue,” “intend,” “should,” “may,” “would,” “projected,” “tends,” “will” or similar expressions, or variations on those terms or the negative of those terms. The Company’s forward-looking statements are subject to numerous risks, uncertainties and other factors. You should review some of these factors that are described under the caption “Risk Factors” in our 2015 Form 10-K and any subsequent periodic report filed with the SEC. Any forward-looking statement speaks only as of the date on which it is made. New risks and uncertainties arise from time to time, and it is impossible for us to predict those events or how they may affect us. Except as required by law, we are not obligated to, and do not intend to, update or revise any forward-looking statements, whether as a result of new information, future events or otherwise. Furthermore, none of the financial information contained in this material has been audited or approved by the Company’s independent registered public accounting firm. Disclaimer
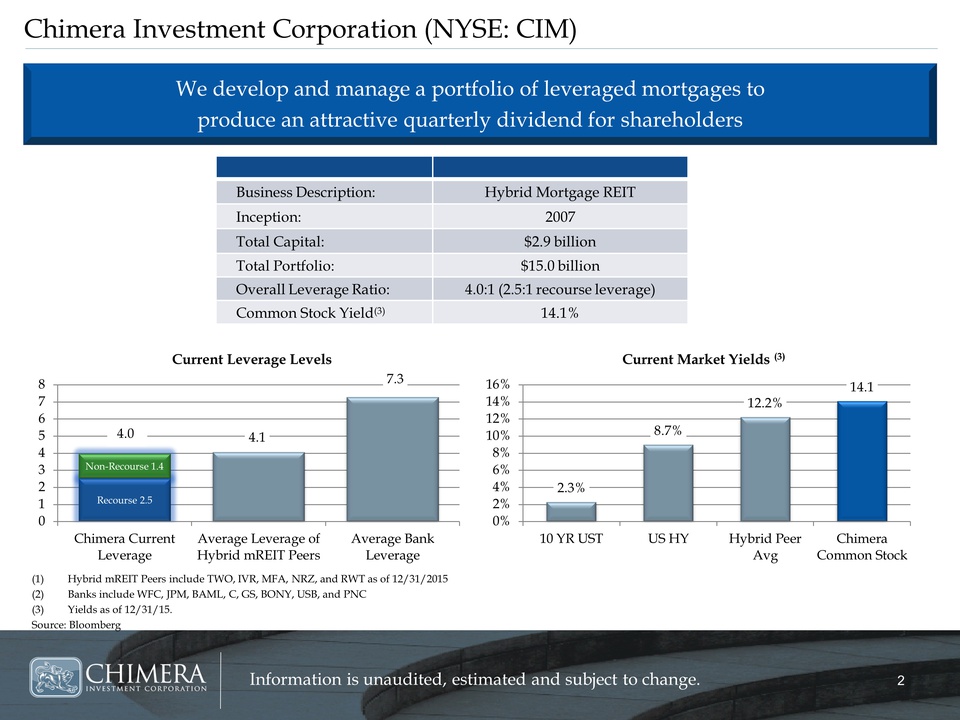
Chimera Investment Corporation (NYSE: CIM) Hybrid mREIT Peers include TWO, IVR, MFA, NRZ, and RWT as of 12/31/2015Banks include WFC, JPM, BAML, C, GS, BONY, USB, and PNCYields as of 12/31/15. Source: Bloomberg We develop and manage a portfolio of leveraged mortgages to produce an attractive quarterly dividend for shareholders Business Description: Hybrid Mortgage REIT Inception: 2007 Total Capital: $2.9 billion Total Portfolio: $15.0 billion Overall Leverage Ratio: 4.0:1 (2.5:1 recourse leverage) Common Stock Yield(3) 14.1% 2.5 Recourse 2.5 Non-Recourse 4.0
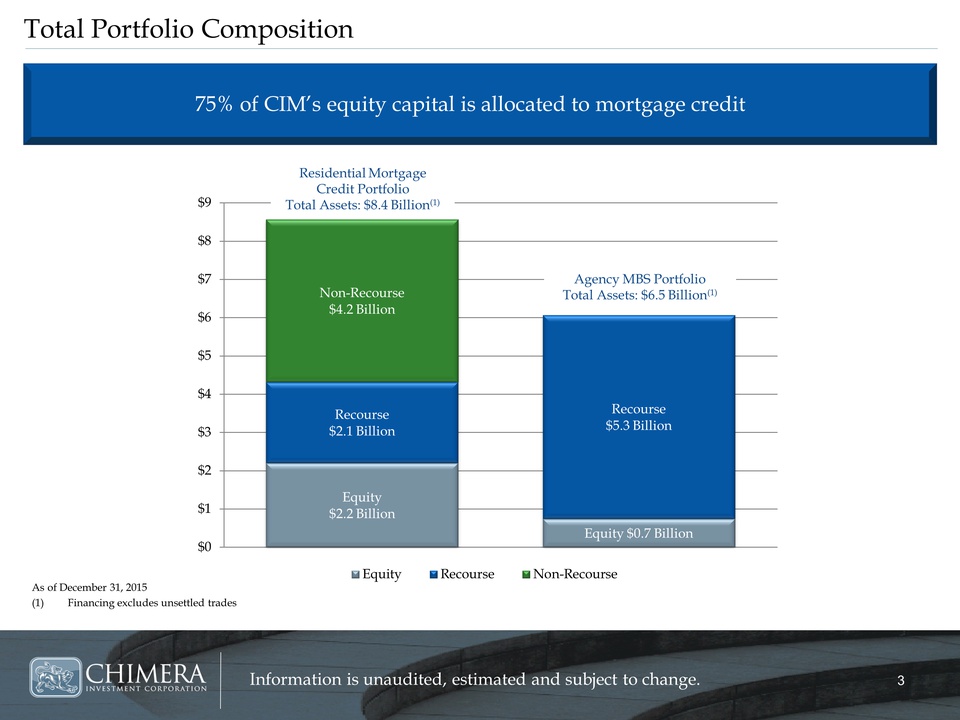
Total Portfolio Composition As of December 31, 2015Financing excludes unsettled trades 75% of CIM’s equity capital is allocated to mortgage credit Residential Mortgage Credit PortfolioTotal Assets: $8.4 Billion(1) Agency MBS PortfolioTotal Assets: $6.5 Billion(1)
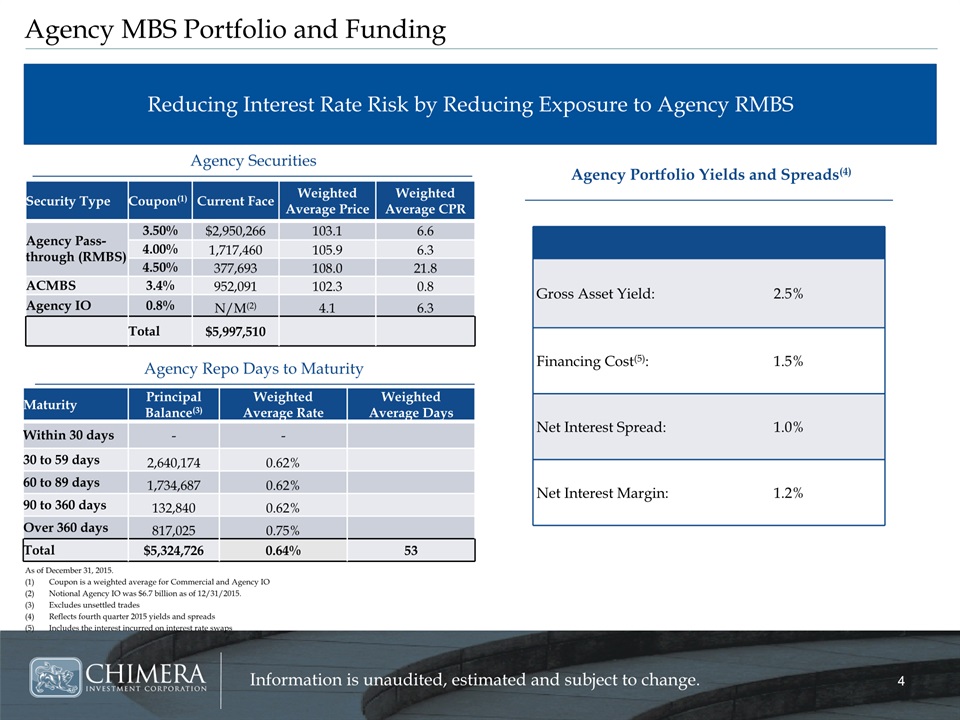
Agency MBS Portfolio and Funding As of December 31, 2015. Coupon is a weighted average for Commercial and Agency IONotional Agency IO was $6.7 billion as of 12/31/2015. Excludes unsettled tradesReflects fourth quarter 2015 yields and spreadsIncludes the interest incurred on interest rate swaps Reducing Interest Rate Risk by Reducing Exposure to Agency RMBS Agency Securities Agency Repo Days to Maturity Agency Portfolio Yields and Spreads(4) Gross Asset Yield: 2.5% Financing Cost(5): 1.5% Net Interest Spread: 1.0% Net Interest Margin: 1.2% Security Type Coupon(1) Current Face Weighted Average Price Weighted Average CPR Agency Pass-through (RMBS) 3.50% $2,950,266 103.1 6.6 4.00% 1,717,460 105.9 6.3 4.50% 377,693 108.0 21.8 ACMBS 3.4% 952,091 102.3 0.8 Agency IO 0.8% N/M(2) 4.1 6.3 Total $5,997,510 Maturity Principal Balance(3) Weighted Average Rate Weighted Average Days Within 30 days - - 30 to 59 days 2,640,174 0.62% 60 to 89 days 1,734,687 0.62% 90 to 360 days 132,840 0.62% Over 360 days 817,025 0.75% Total $5,324,726 0.64% 53
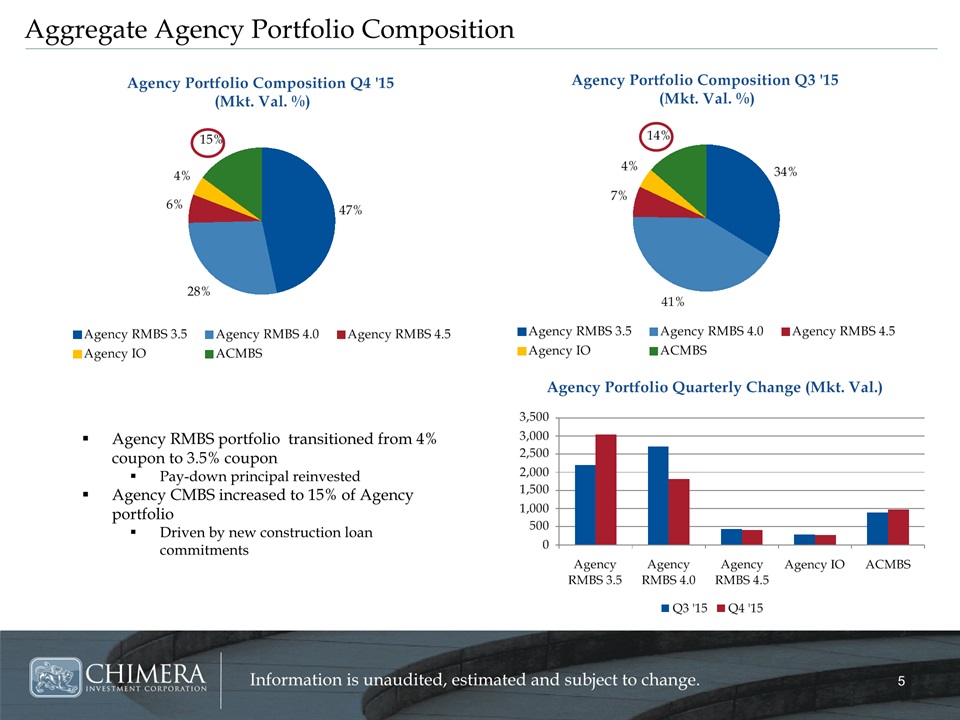
Aggregate Agency Portfolio Composition Agency RMBS portfolio transitioned from 4% coupon to 3.5% couponPay-down principal reinvestedAgency CMBS increased to 15% of Agency portfolioDriven by new construction loan commitments
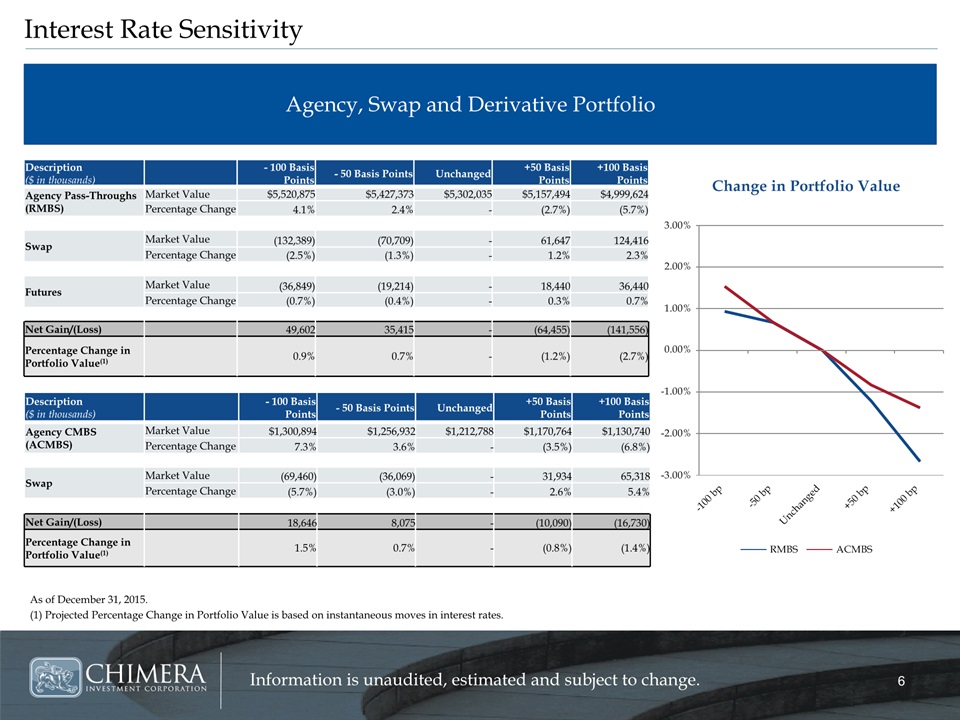
Interest Rate Sensitivity As of December 31, 2015. (1) Projected Percentage Change in Portfolio Value is based on instantaneous moves in interest rates. Agency, Swap and Derivative Portfolio Description($ in thousands) - 100 Basis Points - 50 Basis Points Unchanged +50 Basis Points +100 Basis Points Agency Pass-Throughs (RMBS) Market Value $5,520,875 $5,427,373 $5,302,035 $5,157,494 $4,999,624 Percentage Change 4.1% 2.4% - (2.7%) (5.7%) Swap Market Value (132,389) (70,709) - 61,647 124,416 Percentage Change (2.5%) (1.3%) - 1.2% 2.3% Futures Market Value (36,849) (19,214) - 18,440 36,440 Percentage Change (0.7%) (0.4%) - 0.3% 0.7% Net Gain/(Loss) 49,602 35,415 - (64,455) (141,556) Percentage Change in Portfolio Value(1) 0.9% 0.7% - (1.2%) (2.7%) Description($ in thousands) - 100 Basis Points - 50 Basis Points Unchanged +50 Basis Points +100 Basis Points Agency CMBS(ACMBS) Market Value $1,300,894 $1,256,932 $1,212,788 $1,170,764 $1,130,740 Percentage Change 7.3% 3.6% - (3.5%) (6.8%) Swap Market Value (69,460) (36,069) - 31,934 65,318 Percentage Change (5.7%) (3.0%) - 2.6% 5.4% Net Gain/(Loss) 18,646 8,075 - (10,090) (16,730) Percentage Change in Portfolio Value(1) 1.5% 0.7% - (0.8%) (1.4%)
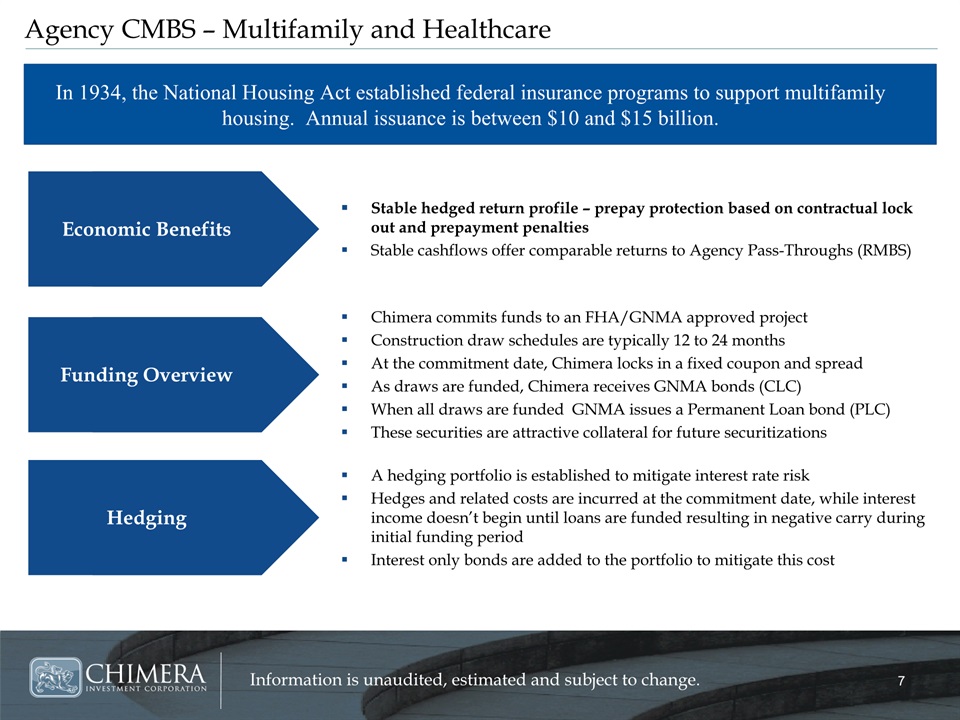
Agency CMBS – Multifamily and Healthcare In 1934, the National Housing Act established federal insurance programs to support multifamily housing. Annual issuance is between $10 and $15 billion. Stable hedged return profile – prepay protection based on contractual lock out and prepayment penaltiesStable cashflows offer comparable returns to Agency Pass-Throughs (RMBS) Economic Benefits Chimera commits funds to an FHA/GNMA approved projectConstruction draw schedules are typically 12 to 24 monthsAt the commitment date, Chimera locks in a fixed coupon and spreadAs draws are funded, Chimera receives GNMA bonds (CLC)When all draws are funded GNMA issues a Permanent Loan bond (PLC)These securities are attractive collateral for future securitizations A hedging portfolio is established to mitigate interest rate riskHedges and related costs are incurred at the commitment date, while interest income doesn’t begin until loans are funded resulting in negative carry during initial funding periodInterest only bonds are added to the portfolio to mitigate this cost Funding Overview Hedging
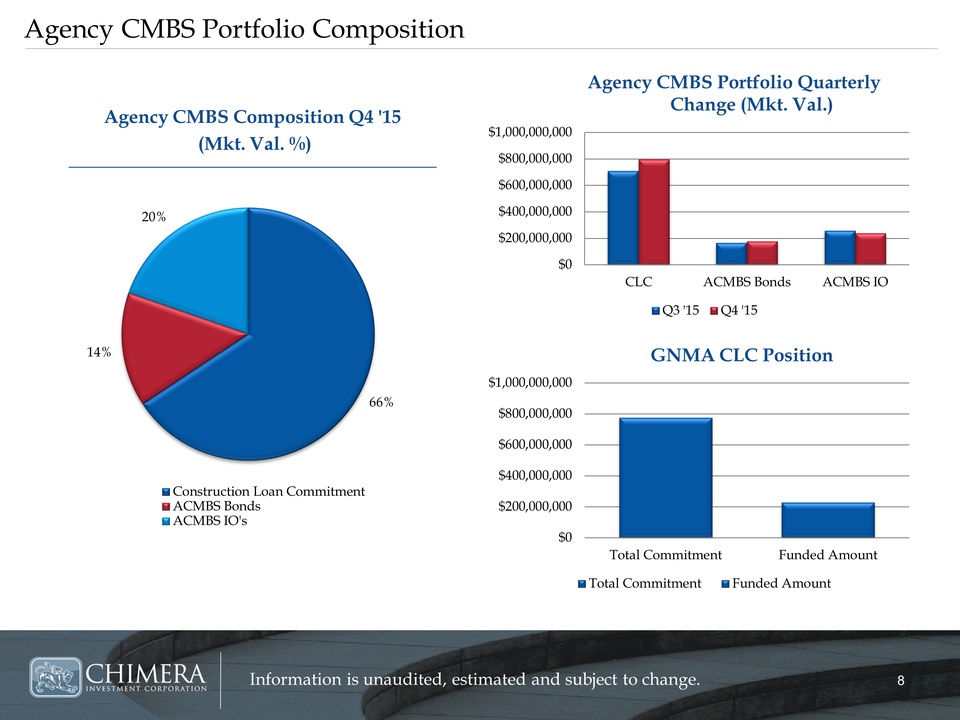
Agency CMBS Portfolio Composition Agency CMBS Composition Q4 '15 (Mkt. Val. %)
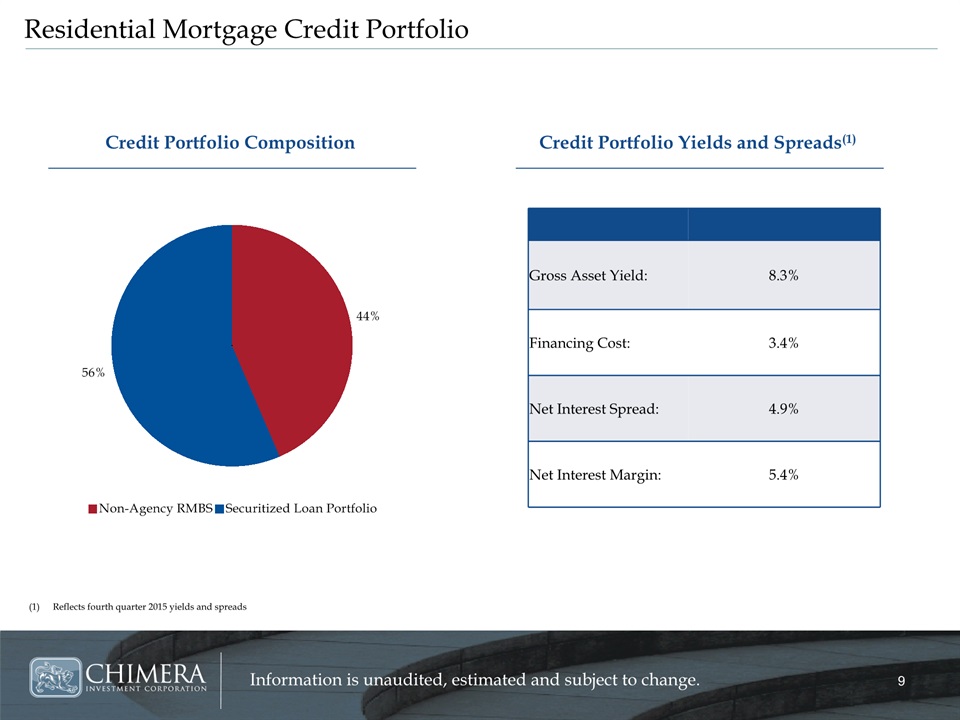
Residential Mortgage Credit Portfolio Credit Portfolio Composition Reflects fourth quarter 2015 yields and spreads Gross Asset Yield: 8.3% Financing Cost: 3.4% Net Interest Spread: 4.9% Net Interest Margin: 5.4% Credit Portfolio Yields and Spreads(1)
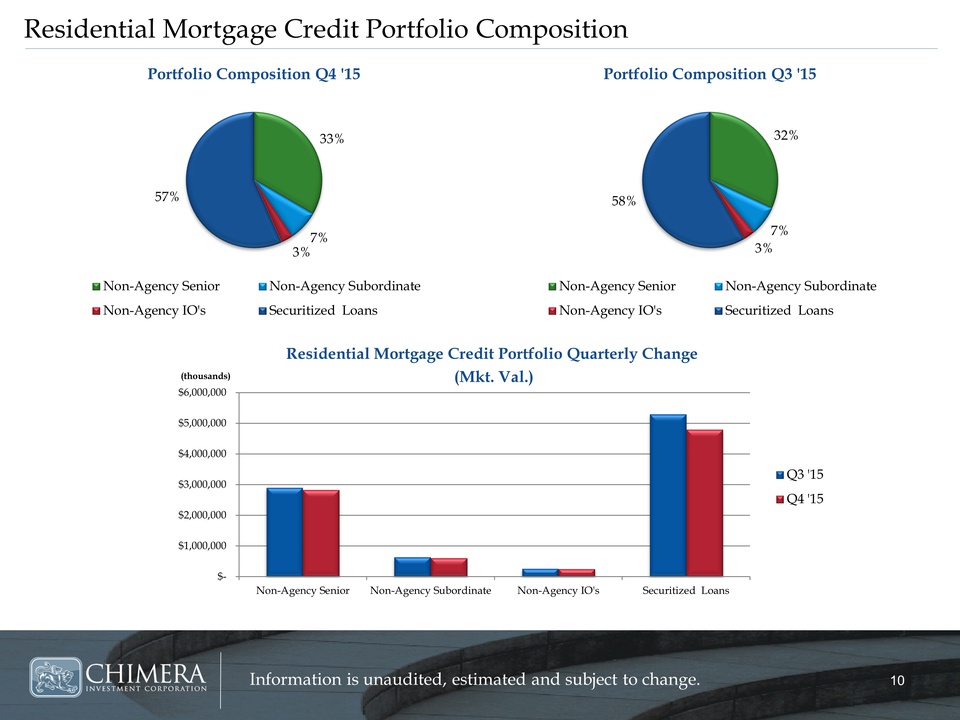
Residential Mortgage Credit Portfolio Composition
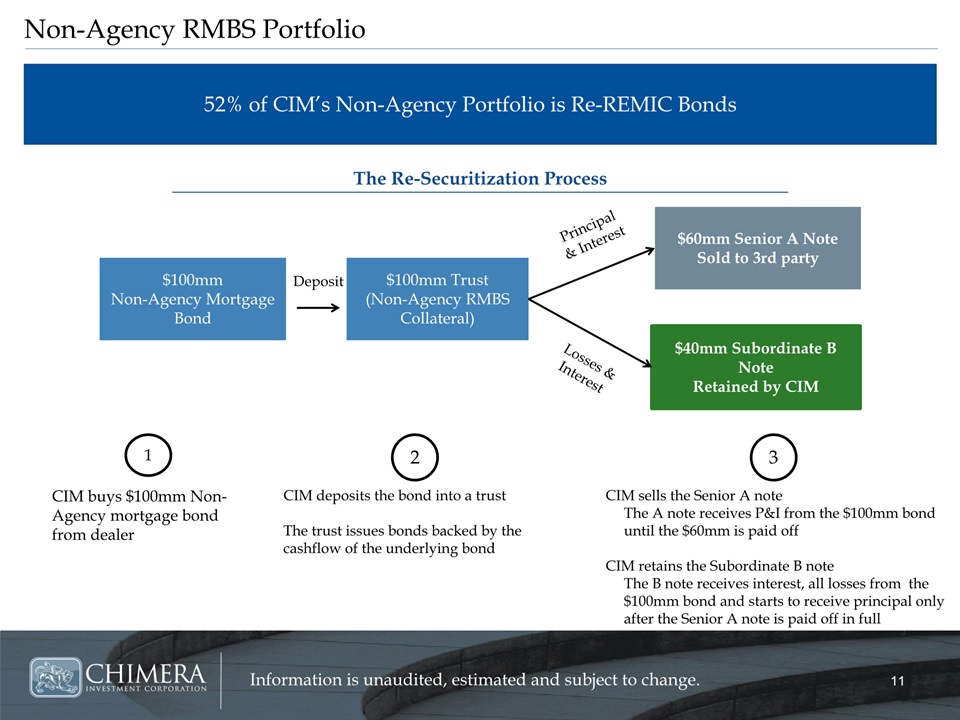
Non-Agency RMBS Portfolio 52% of CIM’s Non-Agency Portfolio is Re-REMIC Bonds The Re-Securitization Process $40mm Subordinate B Note Retained by CIM $100mm Non-Agency Mortgage Bond $100mm Trust(Non-Agency RMBS Collateral) $60mm Senior A Note Sold to 3rd party Deposit Losses & Interest Principal& Interest CIM buys $100mm Non-Agency mortgage bond from dealer CIM deposits the bond into a trust The trust issues bonds backed by the cashflow of the underlying bond CIM sells the Senior A note The A note receives P&I from the $100mm bond until the $60mm is paid offCIM retains the Subordinate B note The B note receives interest, all losses from the $100mm bond and starts to receive principal only after the Senior A note is paid off in full 1 2 3
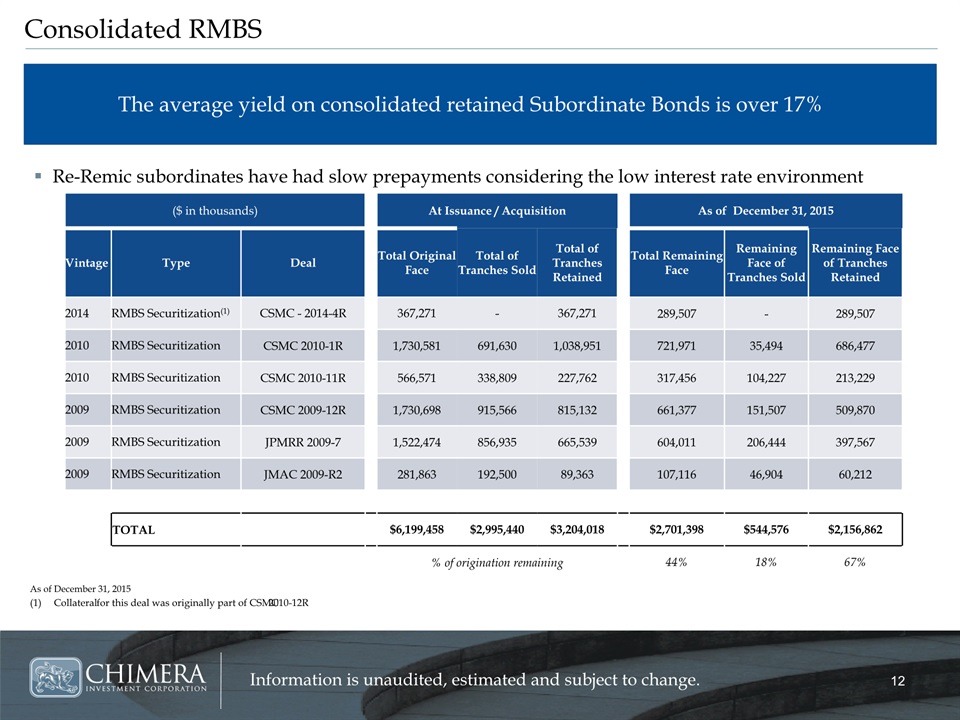
Re-Remic subordinates have had slow prepayments considering the low interest rate environment ($ in thousands) At Issuance / Acquisition As of December 31, 2015 Vintage Type Deal Total Original Face Total of Tranches Sold Total of Tranches Retained Total Remaining Face Remaining Face of Tranches Sold Remaining Face of Tranches Retained 2014 RMBS Securitization(1) CSMC - 2014-4R 367,271 - 367,271 289,507 - 289,507 2010 RMBS Securitization CSMC 2010-1R 1,730,581 691,630 1,038,951 721,971 35,494 686,477 2010 RMBS Securitization CSMC 2010-11R 566,571 338,809 227,762 317,456 104,227 213,229 2009 RMBS Securitization CSMC 2009-12R 1,730,698 915,566 815,132 661,377 151,507 509,870 2009 RMBS Securitization JPMRR 2009-7 1,522,474 856,935 665,539 604,011 206,444 397,567 2009 RMBS Securitization JMAC 2009-R2 281,863 192,500 89,363 107,116 46,904 60,212 TOTAL $6,199,458 $2,995,440 $3,204,018 $2,701,398 $544,576 $2,156,862 % of origination remaining 44% 18% 67% Consolidated RMBS As of December 31, 2015Collateral for this deal was originally part of CSMC 2010-12R The average yield on consolidated retained Subordinate Bonds is over 17%
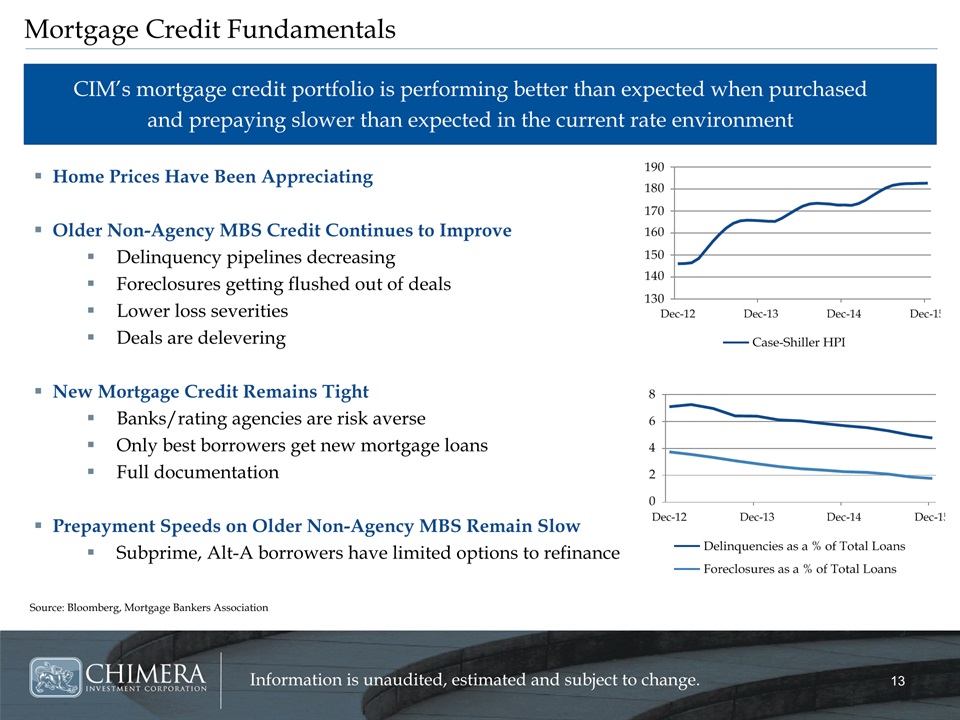
Home Prices Have Been Appreciating Older Non-Agency MBS Credit Continues to ImproveDelinquency pipelines decreasingForeclosures getting flushed out of dealsLower loss severitiesDeals are deleveringNew Mortgage Credit Remains TightBanks/rating agencies are risk averseOnly best borrowers get new mortgage loansFull documentationPrepayment Speeds on Older Non-Agency MBS Remain SlowSubprime, Alt-A borrowers have limited options to refinance Mortgage Credit Fundamentals Source: Bloomberg, Mortgage Bankers Association CIM’s mortgage credit portfolio is performing better than expected when purchased and prepaying slower than expected in the current rate environment
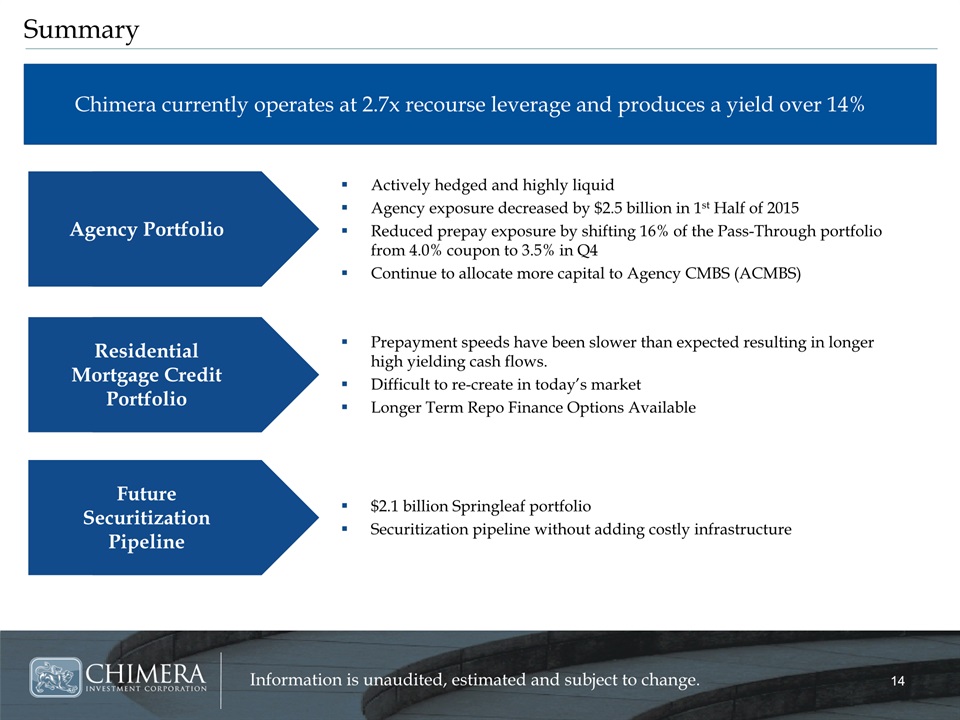
Summary Chimera currently operates at 2.7x recourse leverage and produces a yield over 14% Actively hedged and highly liquidAgency exposure decreased by $2.5 billion in 1st Half of 2015Reduced prepay exposure by shifting 16% of the Pass-Through portfolio from 4.0% coupon to 3.5% in Q4Continue to allocate more capital to Agency CMBS (ACMBS) Agency Portfolio Prepayment speeds have been slower than expected resulting in longer high yielding cash flows. Difficult to re-create in today’s marketLonger Term Repo Finance Options Available $2.1 billion Springleaf portfolioSecuritization pipeline without adding costly infrastructure Residential Mortgage Credit Portfolio Future Securitization Pipeline
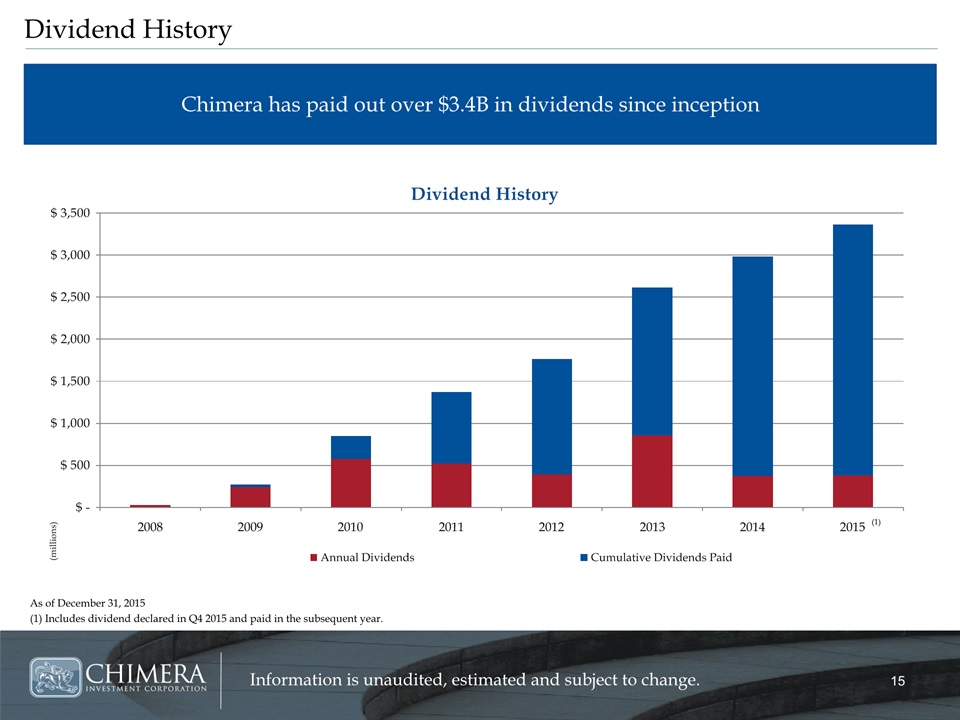
Dividend History Chimera has paid out over $3.4B in dividends since inception As of December 31, 2015(1) Includes dividend declared in Q4 2015 and paid in the subsequent year. (1)