EXHIBIT 99.1
Published on March 6, 2017
INVESTOR
PRESENTATION
NYSE: CIM
4th Quarter 2016
Information is unaudited, estimated and subject to change.
DISCLAIMER This presentation includes “forward-looking statements” within the meaning of the safe harbor provisions of the UnitedStates Private Securities Litigation Reform Act of 1995. Actual results may differ from expectations, estimates andprojections and, consequently, readers should not rely on these forward-looking statements as predictions of future
events. Words such as “goal” “expect,” “target,” “assume,” “estimate,” “project,” “budget,” “forecast,” “anticipate,” “intend,” “plan,”
“may,” “will,” “could,” “should,” “believe,” “predicts,” “potential,” “continue,” and similar expressions are intended to identify
such forward-looking statements. These forward-looking statements involve significant risks and uncertainties that
could cause actual results to differ materially from expected results, including, among other things, those described in
our Annual Report on Form 10-K for the year ended December 31, 2015, and any subsequent Quarterly Reports on Form
10-Q, under the caption “Risk Factors.” Factors that could cause actual results to differ include, but are not limited to: the
state of credit markets and general economic conditions; changes in interest rates and the market value of our assets;
the rates of default or decreased recovery on the mortgages underlying our target assets; the occurrence, extent and
timing of credit losses within our portfolio; the credit risk in our underlying assets; declines in home prices; our ability to
establish, adjust and maintain appropriate hedges for the risks in our portfolio; the availability and cost of our target
assets; our ability to borrow to finance our assets and the associated costs; changes in the competitive landscape within
our industry; our ability to manage various operational risks and costs associated with our business; interruptions in or
impairments to our communications and information technology systems; our ability to acquire residential mortgage
loans and successfully securitize the residential mortgage loans we acquire; our ability to oversee our third party sub-
servicers; the impact of any deficiencies in the servicing or foreclosure practices of third parties and related delays in the
foreclosure process; our exposure to legal and regulatory claims; legislative and regulatory actions affecting our
business; the impact of new or modified government mortgage refinance or principal reduction programs; our ability to
maintain our REIT qualification; and limitations imposed on our business due to our REIT status and our exempt status
under the Investment Company Act of 1940.
Readers are cautioned not to place undue reliance upon any forward-looking statements, which speak only as of the
date made. Chimera does not undertake or accept any obligation to release publicly any updates or revisions to any
forward-looking statement to reflect any change in its expectations or any change in events, conditions or
circumstances on which any such statement is based. Additional information concerning these and other risk factors is
contained in Chimera’s most recent filings with the Securities and Exchange Commission (SEC). All subsequent written
and oral forward-looking statements concerning Chimera or matters attributable to Chimera or any person acting on its
behalf are expressly qualified in their entirety by the cautionary statements above.
This presentation may include industry and market data obtained through research, surveys, and studies conducted by
third parties and industry publications. We have not independently verified any such market and industry data from
third-party sources. This presentation is provided for discussion purposes only and may not be relied upon as legal or
investment advice, nor is it intended to be inclusive of all the risks and uncertainties that should be considered. This
presentation does not constitute an offer to purchase or sell any securities, nor shall it be construed to be indicative of
the terms of an offer that the parties or their respective affiliates would accept.
Readers are advised that the financial information in this presentation is based on company data available at the time of
this presentation and, in certain circumstances, may not have been audited by the company’s independent auditors.
Information is unaudited, estimated and subject to change. 2
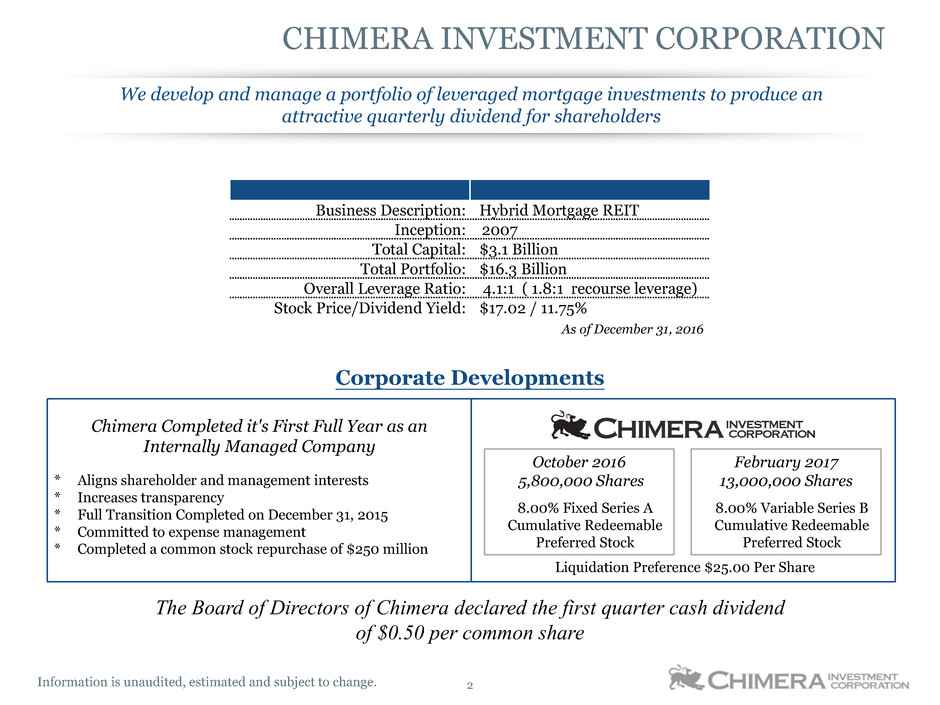
CHIMERA INVESTMENT CORPORATION
We develop and manage a portfolio of leveraged mortgage investments to produce an
attractive quarterly dividend for shareholders
Business Description: Hybrid Mortgage REIT
Inception: 2007
Total Capital: $3.1 Billion
Total Portfolio: $16.3 Billion
Overall Leverage Ratio: 4.1:1 ( 1.8:1 recourse leverage)
Stock Price/Dividend Yield: $17.02 / 11.75%
Chimera Completed it's First Full Year as an
Internally Managed Company
* Aligns shareholder and management interests
* Increases transparency
* Full Transition Completed on December 31, 2015
* Committed to expense management
* Completed a common stock repurchase of $250 million
Corporate Developments
As of December 31, 2016
The Board of Directors of Chimera declared the first quarter cash dividend
of $0.50 per common share
February 2017
13,000,000 Shares
8.00% Variable Series B
Cumulative Redeemable
Preferred Stock
October 2016
5,800,000 Shares
8.00% Fixed Series A
Cumulative Redeemable
Preferred Stock
Liquidation Preference $25.00 Per Share
Information is unaudited, estimated and subject to change. 3
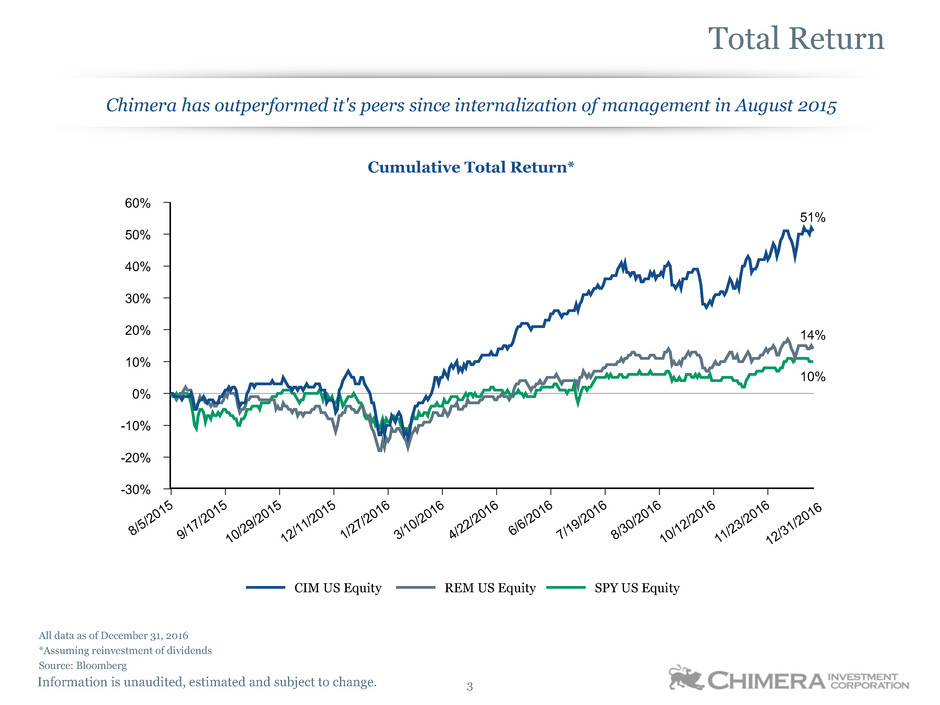
Total Return
Chimera has outperformed it's peers since internalization of management in August 2015
All data as of December 31, 2016
*Assuming reinvestment of dividends
Source: Bloomberg
CIM US Equity REM US Equity SPY US Equity
Cumulative Total Return*
60%
50%
40%
30%
20%
10%
0%
-10%
-20%
-30%
8/5
/20
15
9/1
7/2
015
10/
29/
201
5
12/
11/
201
5
1/2
7/2
016
3/1
0/2
016
4/2
2/2
016
6/6
/20
16
7/1
9/2
016
8/3
0/2
016
10/
12/
201
6
11/
23/
201
6
51%
14%
10%
12/31/201
6
Information is unaudited, estimated and subject to change. 4
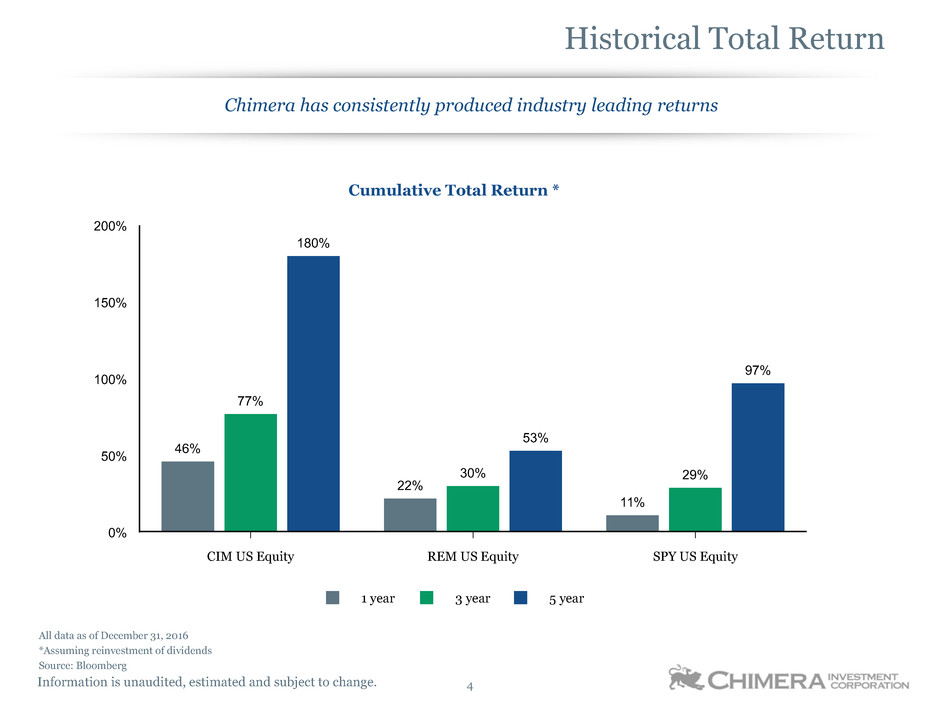
Historical Total Return
Chimera has consistently produced industry leading returns
All data as of December 31, 2016
*Assuming reinvestment of dividends
Source: Bloomberg
1 year 3 year 5 year
Cumulative Total Return *
200%
150%
100%
50%
0%
CIM US Equity REM US Equity SPY US Equity
46%
22%
11%
77%
30% 29%
180%
53%
97%
Information is unaudited, estimated and subject to change. 5
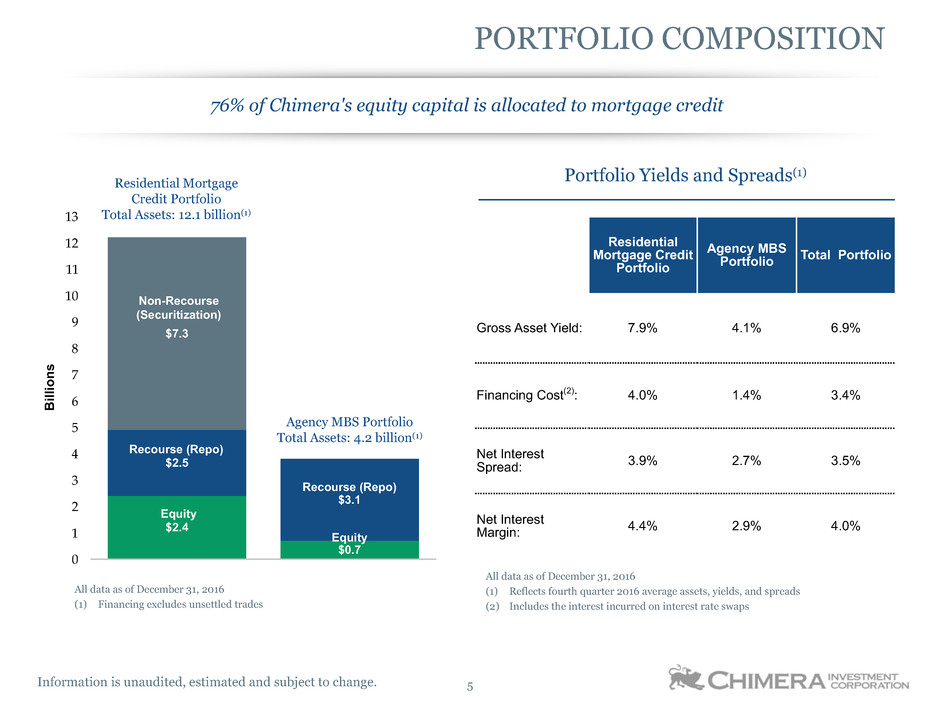
PORTFOLIO COMPOSITION
Residential
Mortgage Credit
Portfolio
Agency MBS
Portfolio Total Portfolio
Gross Asset Yield: 7.9% 4.1% 6.9%
Financing Cost(2): 4.0% 1.4% 3.4%
Net Interest
Spread: 3.9% 2.7% 3.5%
Net Interest
Margin: 4.4% 2.9% 4.0%
Portfolio Yields and Spreads(1)
13
12
11
10
9
8
7
6
5
4
3
2
1
0
B
ill
io
ns
$2.4
$0.7
$2.5
$3.1
$7.3
Non-Recourse
(Securitization)
Recourse (Repo)
Recourse (Repo)
Equity
Equity
Agency MBS Portfolio
Total Assets: 4.2 billion(1)
Residential Mortgage
Credit Portfolio
Total Assets: 12.1 billion(1)
76% of Chimera's equity capital is allocated to mortgage credit
All data as of December 31, 2016
(1) Reflects fourth quarter 2016 average assets, yields, and spreads
(2) Includes the interest incurred on interest rate swaps
All data as of December 31, 2016
(1) Financing excludes unsettled trades
Information is unaudited, estimated and subject to change. 6
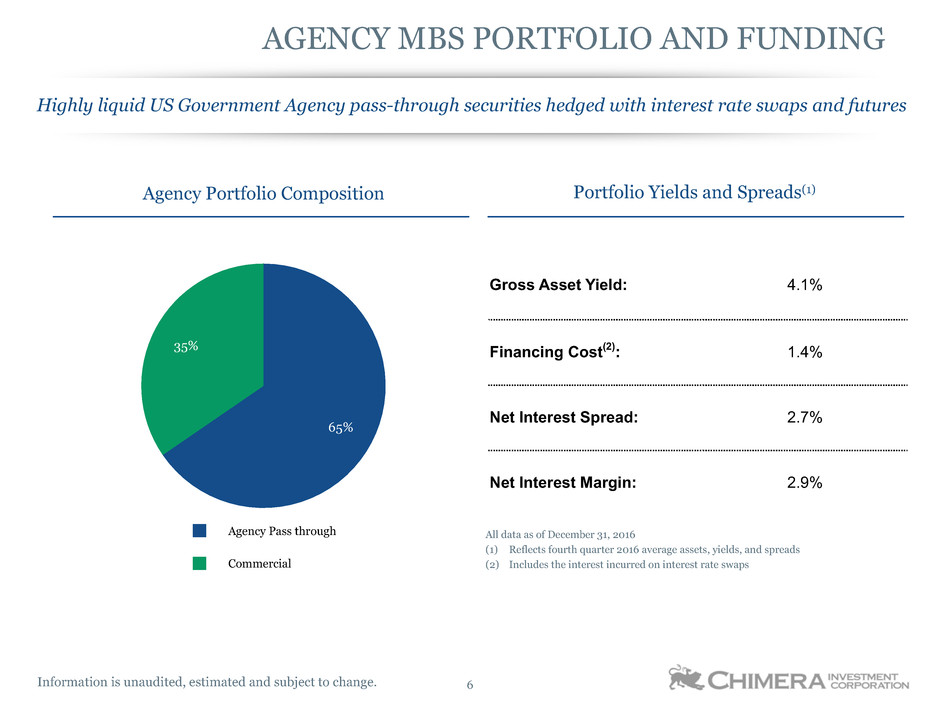
Agency Portfolio Composition
All data as of December 31, 2016
(1) Reflects fourth quarter 2016 average assets, yields, and spreads
(2) Includes the interest incurred on interest rate swaps
AGENCY MBS PORTFOLIO AND FUNDING
Highly liquid US Government Agency pass-through securities hedged with interest rate swaps and futures
Gross Asset Yield: 4.1%
Financing Cost(2): 1.4%
Net Interest Spread: 2.7%
Net Interest Margin: 2.9%
Agency Pass through
Commercial
65%
35%
Portfolio Yields and Spreads(1)
Information is unaudited, estimated and subject to change. 7
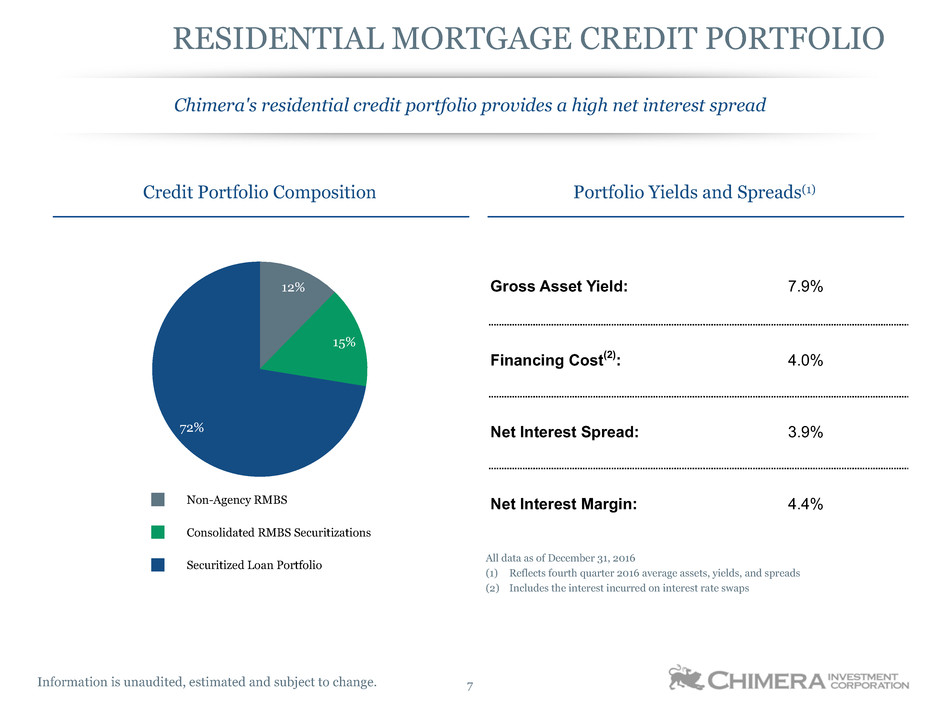
Non-Agency RMBS
Consolidated RMBS Securitizations
Securitized Loan Portfolio
12%
15%
72%
RESIDENTIAL MORTGAGE CREDIT PORTFOLIO
Chimera's residential credit portfolio provides a high net interest spread
Gross Asset Yield: 7.9%
Financing Cost(2): 4.0%
Net Interest Spread: 3.9%
Net Interest Margin: 4.4%
Portfolio Yields and Spreads(1)Credit Portfolio Composition
All data as of December 31, 2016
(1) Reflects fourth quarter 2016 average assets, yields, and spreads
(2) Includes the interest incurred on interest rate swaps
Information is unaudited, estimated and subject to change. 8
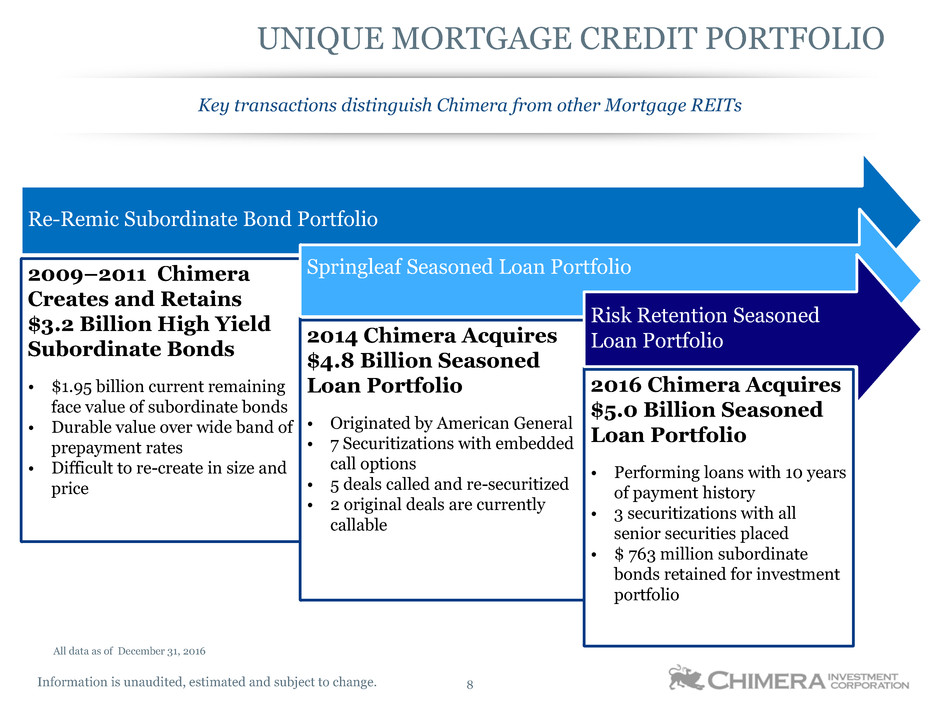
2016 Chimera Acquires
$5.0 Billion Seasoned
Loan Portfolio
• Performing loans with 10 years
of payment history
• 3 securitizations with all
senior securities placed
• $ 763 million subordinate
bonds retained for investment
portfolio
2014 Chimera Acquires
$4.8 Billion Seasoned
Loan Portfolio
• Originated by American General
• 7 Securitizations with embedded
call options
• 5 deals called and re-securitized
• 2 original deals are currently
callable
2009–2011 Chimera
Creates and Retains
$3.2 Billion High Yield
Subordinate Bonds
• $1.95 billion current remaining
face value of subordinate bonds
• Durable value over wide band of
prepayment rates
• Difficult to re-create in size and
price
UNIQUE MORTGAGE CREDIT PORTFOLIO
Key transactions distinguish Chimera from other Mortgage REITs
Re-Remic Subordinate Bond Portfolio
Springleaf Seasoned Loan Portfolio
Risk Retention Seasoned
Loan Portfolio
All data as of December 31, 2016
Information is unaudited, estimated and subject to change. 9
RE-REMIC SUBORDINATE BOND PORTFOLIO
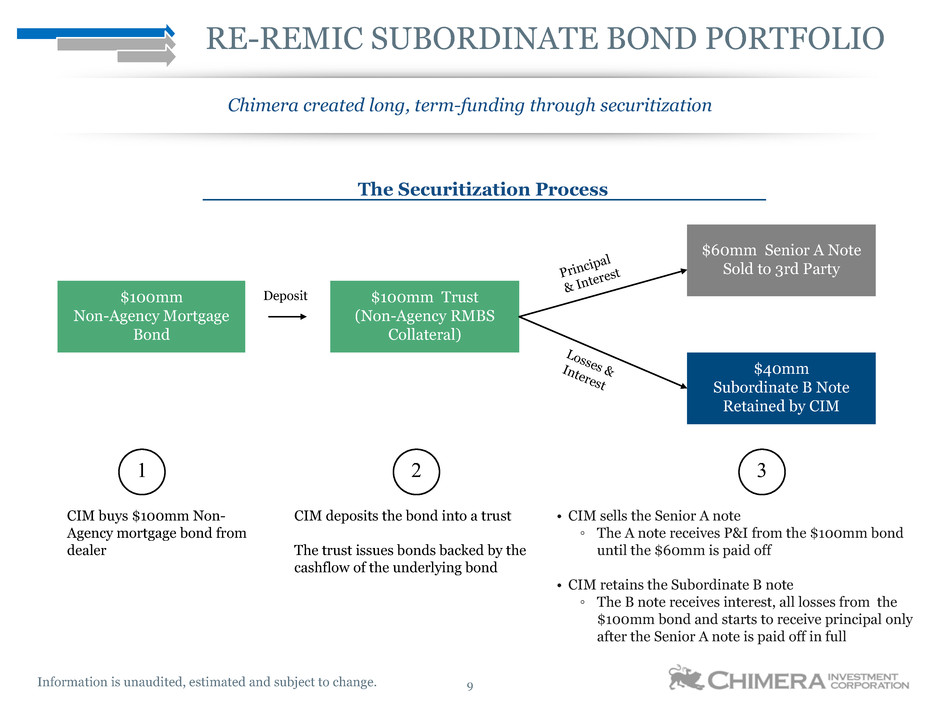
Chimera created long, term-funding through securitization
The Securitization Process
$100mm
Non-Agency Mortgage
Bond
$100mm Trust
(Non-Agency RMBS
Collateral)
Deposit
$60mm Senior A Note
Sold to 3rd Party
$40mm
Subordinate B Note
Retained by CIM
CIM buys $100mm Non-
Agency mortgage bond from
dealer
CIM deposits the bond into a trust
The trust issues bonds backed by the
cashflow of the underlying bond
• CIM sells the Senior A note
◦ The A note receives P&I from the $100mm bond
until the $60mm is paid off
• CIM retains the Subordinate B note
◦ The B note receives interest, all losses from the
$100mm bond and starts to receive principal only
after the Senior A note is paid off in full
Principa
l
& Interes
t
Losses
&Interes
t
1 2 3
Information is unaudited, estimated and subject to change. 10
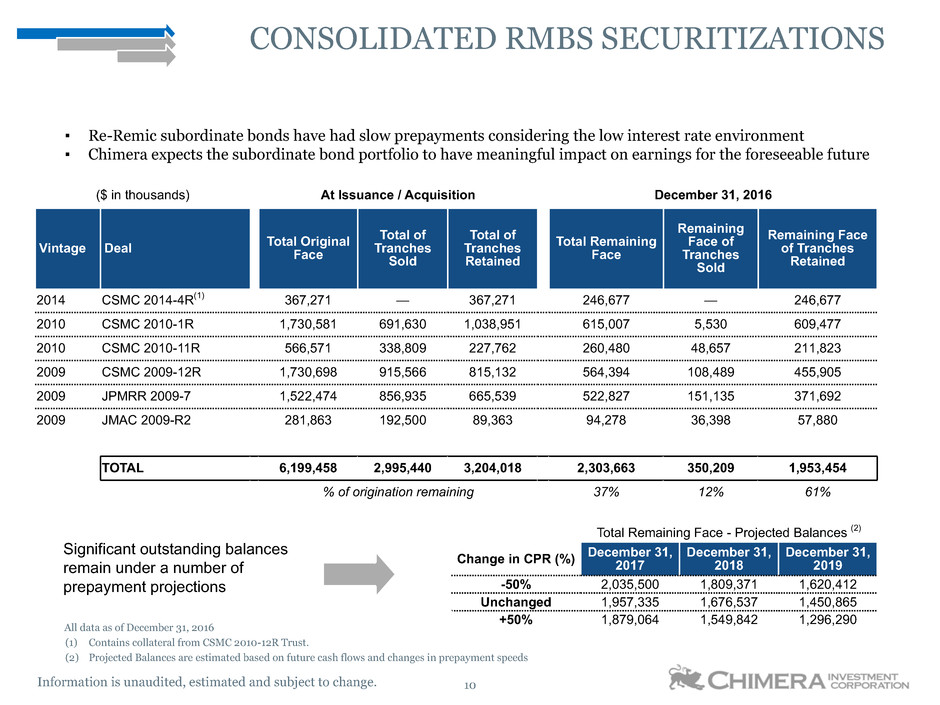
($ in thousands) At Issuance / Acquisition December 31, 2016
Vintage Deal Total OriginalFace
Total of
Tranches
Sold
Total of
Tranches
Retained
Total Remaining
Face
Remaining
Face of
Tranches
Sold
Remaining Face
of Tranches
Retained
2014 CSMC 2014-4R(1) 367,271 — 367,271 246,677 — 246,677
2010 CSMC 2010-1R 1,730,581 691,630 1,038,951 615,007 5,530 609,477
2010 CSMC 2010-11R 566,571 338,809 227,762 260,480 48,657 211,823
2009 CSMC 2009-12R 1,730,698 915,566 815,132 564,394 108,489 455,905
2009 JPMRR 2009-7 1,522,474 856,935 665,539 522,827 151,135 371,692
2009 JMAC 2009-R2 281,863 192,500 89,363 94,278 36,398 57,880
TOTAL 6,199,458 2,995,440 3,204,018 2,303,663 350,209 1,953,454
% of origination remaining 37% 12% 61%
CONSOLIDATED RMBS SECURITIZATIONS
▪ Re-Remic subordinate bonds have had slow prepayments considering the low interest rate environment
▪ Chimera expects the subordinate bond portfolio to have meaningful impact on earnings for the foreseeable future
All data as of December 31, 2016
(1) Contains collateral from CSMC 2010-12R Trust.
(2) Projected Balances are estimated based on future cash flows and changes in prepayment speeds
Significant outstanding balances
remain under a number of
prepayment projections
Total Remaining Face - Projected Balances (2)
Change in CPR (%) December 31,2017
December 31,
2018
December 31,
2019
-50% 2,035,500 1,809,371 1,620,412
Unchanged 1,957,335 1,676,537 1,450,865
+50% 1,879,064 1,549,842 1,296,290
Information is unaudited, estimated and subject to change. 11
SPRINGLEAF SEASONED LOAN PORTFOLIO
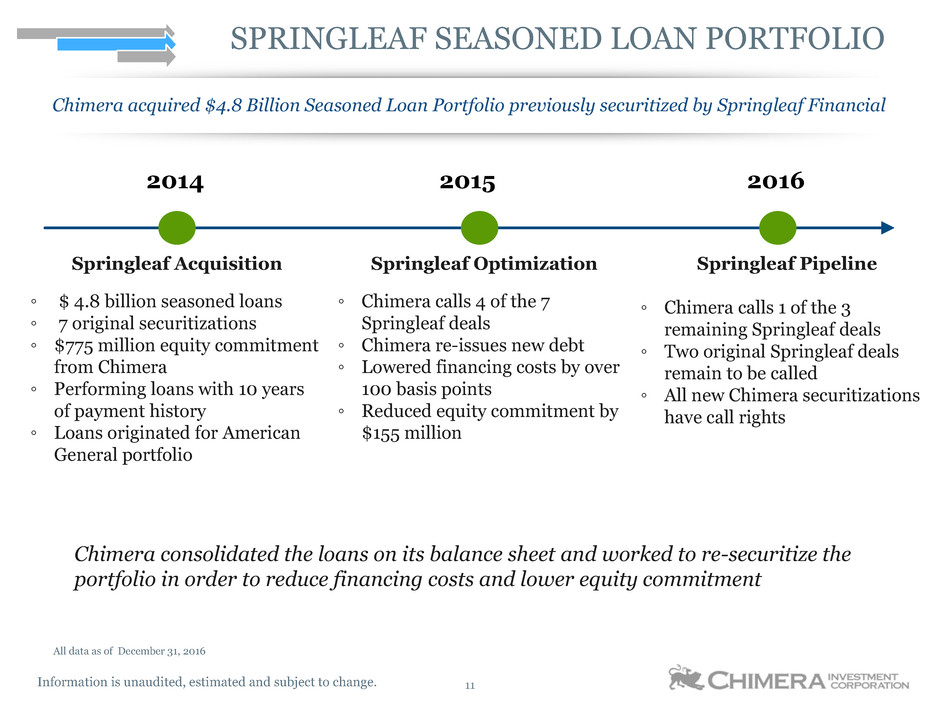
Chimera acquired $4.8 Billion Seasoned Loan Portfolio previously securitized by Springleaf Financial
Chimera consolidated the loans on its balance sheet and worked to re-securitize the
portfolio in order to reduce financing costs and lower equity commitment
Springleaf Acquisition
◦ $ 4.8 billion seasoned loans
◦ 7 original securitizations
◦ $775 million equity commitment
from Chimera
◦ Performing loans with 10 years
of payment history
◦ Loans originated for American
General portfolio
Springleaf Optimization
◦ Chimera calls 4 of the 7
Springleaf deals
◦ Chimera re-issues new debt
◦ Lowered financing costs by over
100 basis points
◦ Reduced equity commitment by
$155 million
Springleaf Pipeline
◦ Chimera calls 1 of the 3
remaining Springleaf deals
◦ Two original Springleaf deals
remain to be called
◦ All new Chimera securitizations
have call rights
2014 2015 2016
All data as of December 31, 2016
Information is unaudited, estimated and subject to change. 12
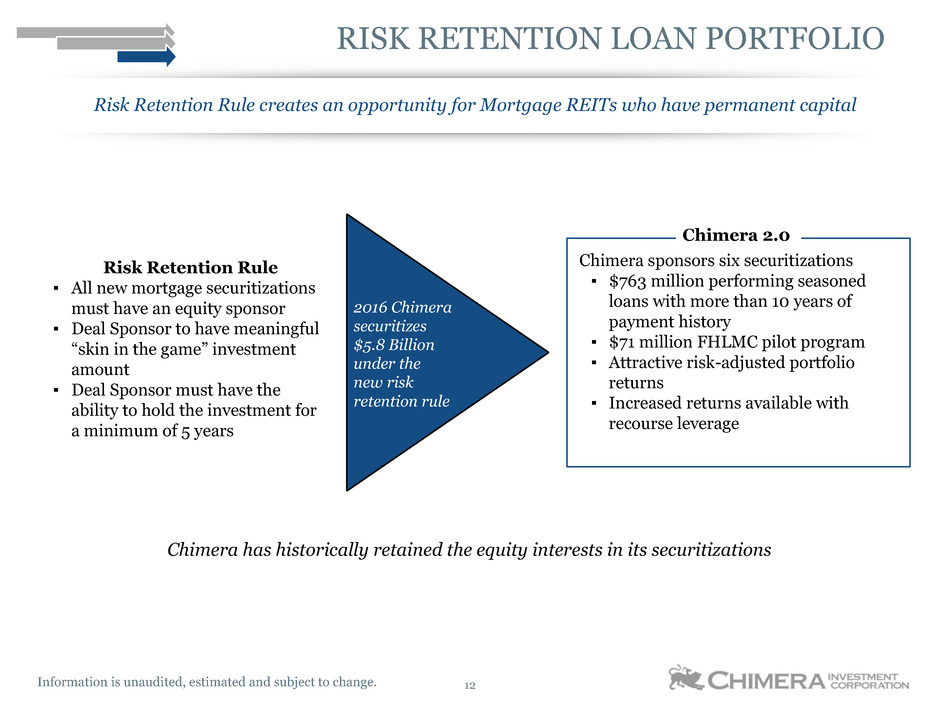
RISK RETENTION LOAN PORTFOLIO
Risk Retention Rule creates an opportunity for Mortgage REITs who have permanent capital
Risk Retention Rule
▪ All new mortgage securitizations
must have an equity sponsor
▪ Deal Sponsor to have meaningful
“skin in the game” investment
amount
▪ Deal Sponsor must have the
ability to hold the investment for
a minimum of 5 years
Chimera sponsors six securitizations
▪ $763 million performing seasoned
loans with more than 10 years of
payment history
▪ $71 million FHLMC pilot program
▪ Attractive risk-adjusted portfolio
returns
▪ Increased returns available with
recourse leverage
2016 Chimera
securitizes
$5.8 Billion
under the
new risk
retention rule
Chimera 2.0
Chimera has historically retained the equity interests in its securitizations
Information is unaudited, estimated and subject to change. 13
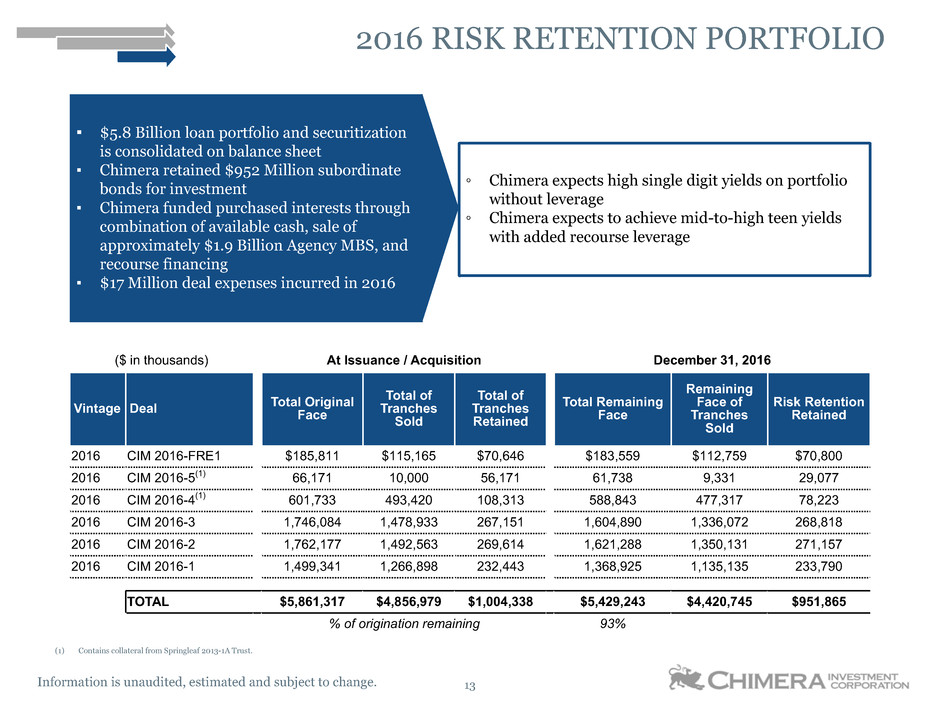
($ in thousands) At Issuance / Acquisition December 31, 2016
Vintage Deal Total OriginalFace
Total of
Tranches
Sold
Total of
Tranches
Retained
Total Remaining
Face
Remaining
Face of
Tranches
Sold
Risk Retention
Retained
2016 CIM 2016-FRE1 $185,811 $115,165 $70,646 $183,559 $112,759 $70,800
2016 CIM 2016-5(1) 66,171 10,000 56,171 61,738 9,331 29,077
2016 CIM 2016-4(1) 601,733 493,420 108,313 588,843 477,317 78,223
2016 CIM 2016-3 1,746,084 1,478,933 267,151 1,604,890 1,336,072 268,818
2016 CIM 2016-2 1,762,177 1,492,563 269,614 1,621,288 1,350,131 271,157
2016 CIM 2016-1 1,499,341 1,266,898 232,443 1,368,925 1,135,135 233,790
TOTAL $5,861,317 $4,856,979 $1,004,338 $5,429,243 $4,420,745 $951,865
% of origination remaining 93%
(1) Contains collateral from Springleaf 2013-1A Trust.
2016 RISK RETENTION PORTFOLIO
▪ $5.8 Billion loan portfolio and securitization
is consolidated on balance sheet
▪ Chimera retained $952 Million subordinate
bonds for investment
▪ Chimera funded purchased interests through
combination of available cash, sale of
approximately $1.9 Billion Agency MBS, and
recourse financing
▪ $17 Million deal expenses incurred in 2016
◦ Chimera expects high single digit yields on portfolio
without leverage
◦ Chimera expects to achieve mid-to-high teen yields
with added recourse leverage
Information is unaudited, estimated and subject to change. 14
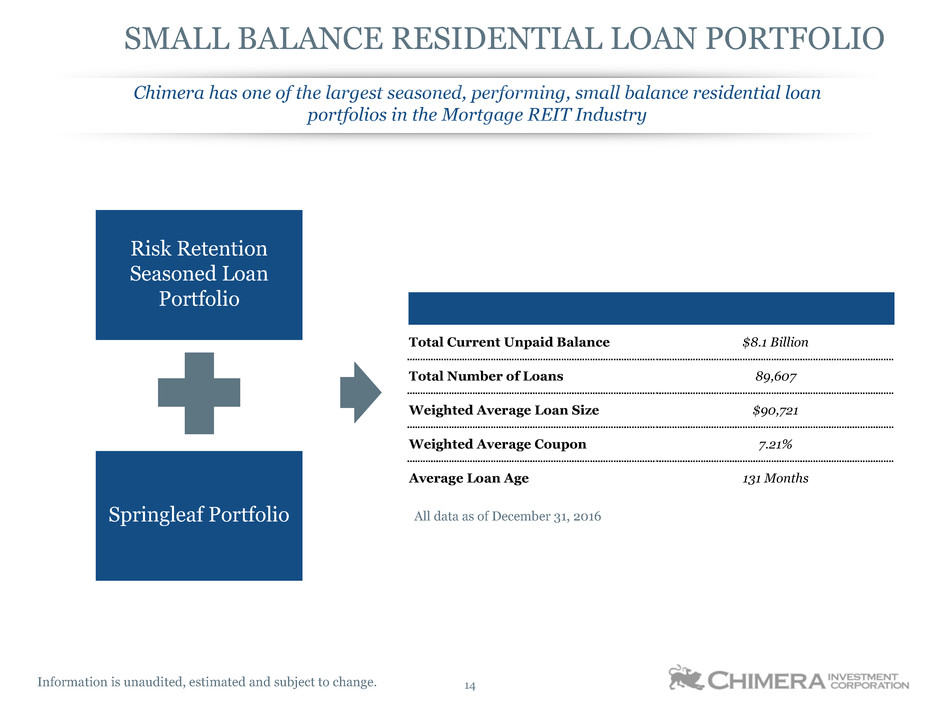
SMALL BALANCE RESIDENTIAL LOAN PORTFOLIO
Chimera has one of the largest seasoned, performing, small balance residential loan
portfolios in the Mortgage REIT Industry
Risk Retention
Seasoned Loan
Portfolio
Springleaf Portfolio All data as of December 31, 2016
Total Current Unpaid Balance $8.1 Billion
Total Number of Loans 89,607
Weighted Average Loan Size $90,721
Weighted Average Coupon 7.21%
Average Loan Age 131 Months
Information is unaudited, estimated and subject to change. 15
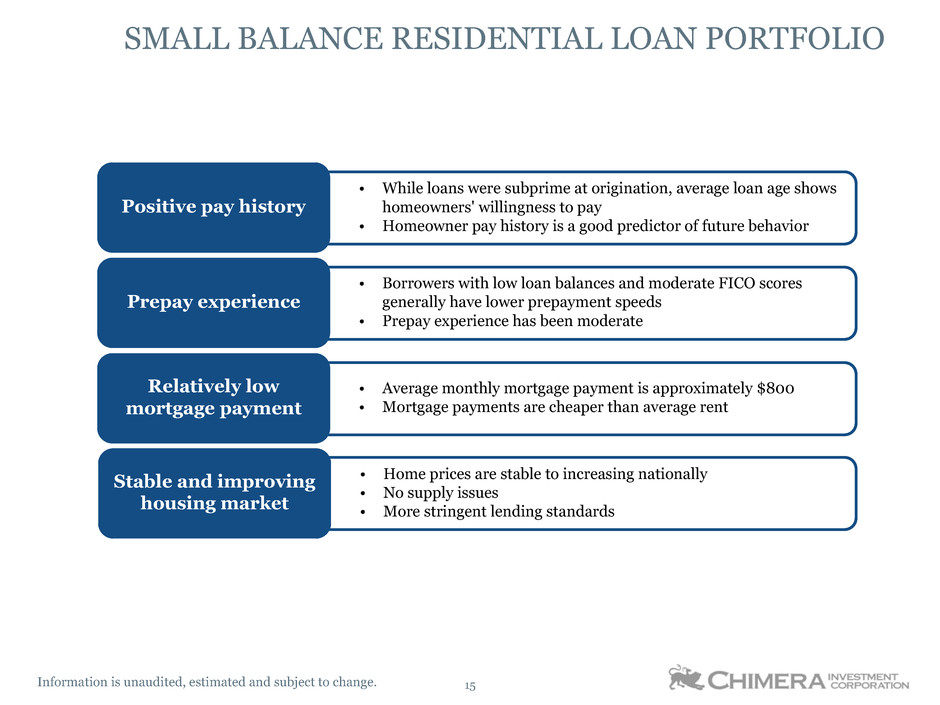
SMALL BALANCE RESIDENTIAL LOAN PORTFOLIO
Positive pay history
Prepay experience
Relatively low
mortgage payment
• While loans were subprime at origination, average loan age shows
homeowners' willingness to pay
• Homeowner pay history is a good predictor of future behavior
• Borrowers with low loan balances and moderate FICO scores
generally have lower prepayment speeds
• Prepay experience has been moderate
• Average monthly mortgage payment is approximately $800
• Mortgage payments are cheaper than average rent
Stable and improving
housing market
• Home prices are stable to increasing nationally
• No supply issues
• More stringent lending standards
Information is unaudited, estimated and subject to change. 16
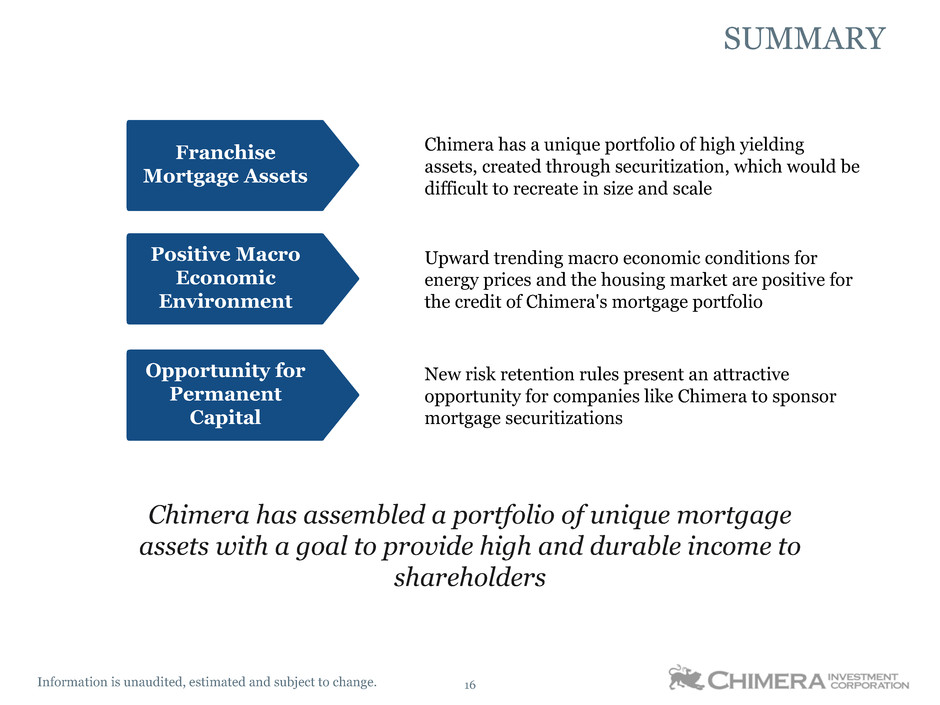
SUMMARY
Chimera has a unique portfolio of high yielding
assets, created through securitization, which would be
difficult to recreate in size and scale
Upward trending macro economic conditions for
energy prices and the housing market are positive for
the credit of Chimera's mortgage portfolio
New risk retention rules present an attractive
opportunity for companies like Chimera to sponsor
mortgage securitizations
Chimera has assembled a portfolio of unique mortgage
assets with a goal to provide high and durable income to
shareholders
Opportunity for
Permanent
Capital
Positive Macro
Economic
Environment
Franchise
Mortgage Assets
Information is unaudited, estimated and subject to change.
Appendix
Information is unaudited, estimated and subject to change. 18
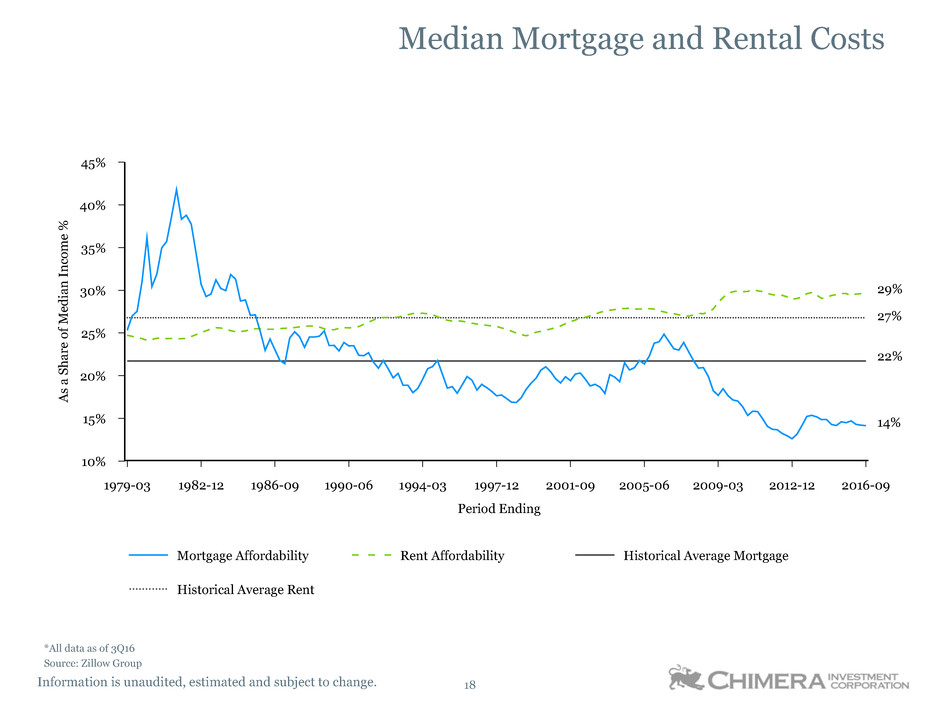
Median Mortgage and Rental Costs
Mortgage Affordability Rent Affordability Historical Average Mortgage
Historical Average Rent
45%
40%
35%
30%
25%
20%
15%
10%
As
aS
ha
re
of
M
ed
ia
n
In
co
m
e%
1979-03 1982-12 1986-09 1990-06 1994-03 1997-12 2001-09 2005-06 2009-03 2012-12 2016-09
Period Ending
*All data as of 3Q16
Source: Zillow Group
29%
27%
22%
14%
Information is unaudited, estimated and subject to change. 19
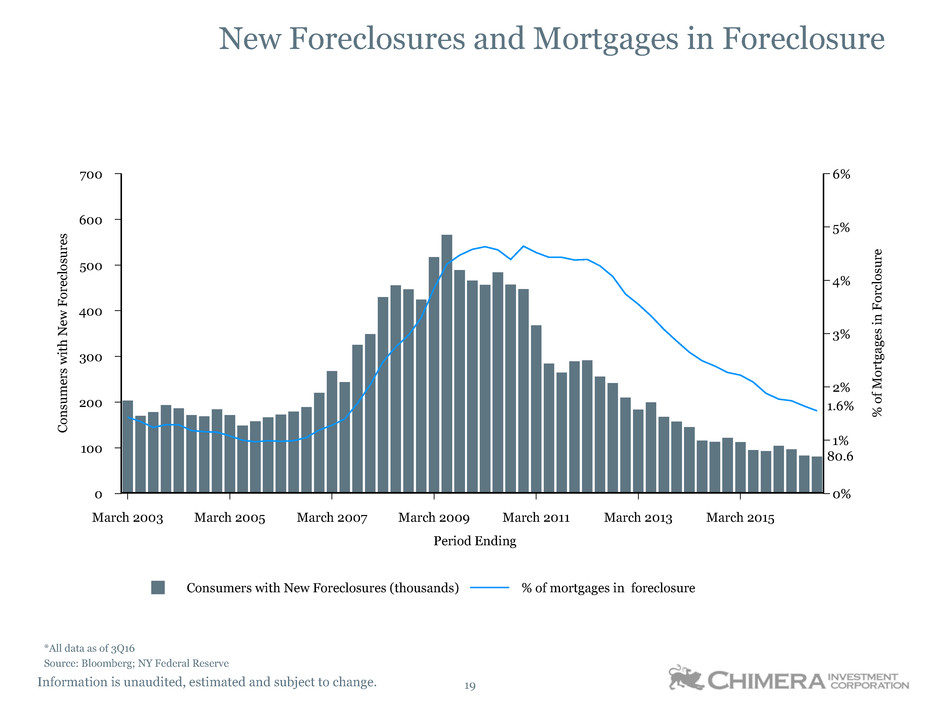
New Foreclosures and Mortgages in Foreclosure
Consumers with New Foreclosures (thousands) % of mortgages in foreclosure
700
600
500
400
300
200
100
0
Co
ns
um
er
sw
ith
N
ew
Fo
re
clo
su
re
s
6%
5%
4%
3%
2%
1%
0%
%
of
M
or
tg
ag
es
in
Fo
rc
lo
su
re
March 2003 March 2005 March 2007 March 2009 March 2011 March 2013 March 2015
Period Ending
*All data as of 3Q16
Source: Bloomberg; NY Federal Reserve
1.6%
80.6
Information is unaudited, estimated and subject to change. 20
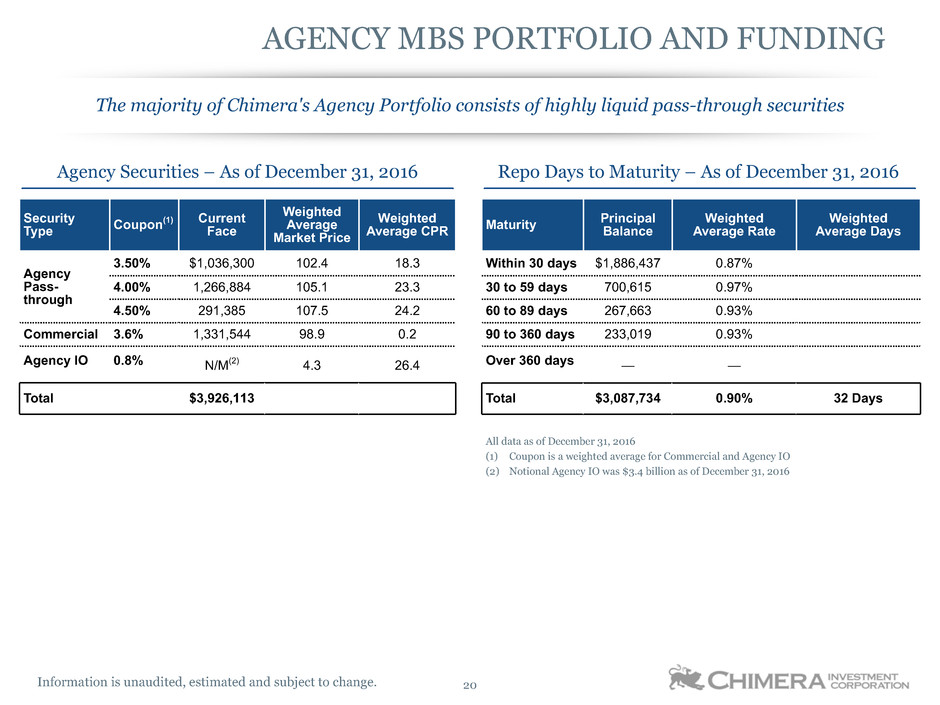
Agency Securities – As of December 31, 2016 Repo Days to Maturity – As of December 31, 2016
Security
Type Coupon
(1) Current
Face
Weighted
Average
Market Price
Weighted
Average CPR
Agency
Pass-
through
3.50% $1,036,300 102.4 18.3
4.00% 1,266,884 105.1 23.3
4.50% 291,385 107.5 24.2
Commercial 3.6% 1,331,544 98.9 0.2
Agency IO 0.8% N/M(2) 4.3 26.4
Total $3,926,113
Maturity PrincipalBalance
Weighted
Average Rate
Weighted
Average Days
Within 30 days $1,886,437 0.87%
30 to 59 days 700,615 0.97%
60 to 89 days 267,663 0.93%
90 to 360 days 233,019 0.93%
Over 360 days — —
Total $3,087,734 0.90% 32 Days
The majority of Chimera's Agency Portfolio consists of highly liquid pass-through securities
AGENCY MBS PORTFOLIO AND FUNDING
All data as of December 31, 2016
(1) Coupon is a weighted average for Commercial and Agency IO
(2) Notional Agency IO was $3.4 billion as of December 31, 2016
Information is unaudited, estimated and subject to change. 21
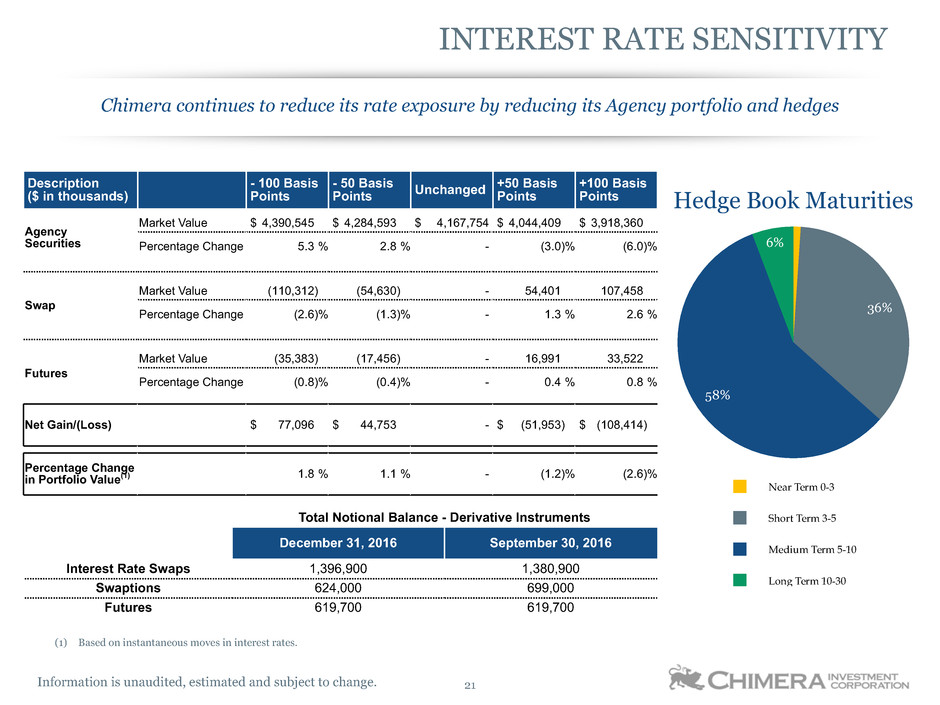
Description
($ in thousands)
- 100 Basis
Points
- 50 Basis
Points Unchanged
+50 Basis
Points
+100 Basis
Points
Agency
Securities
Market Value $ 4,390,545 $ 4,284,593 $ 4,167,754 $ 4,044,409 $ 3,918,360
Percentage Change 5.3 % 2.8 % - (3.0)% (6.0)%
Swap
Market Value (110,312) (54,630) - 54,401 107,458
Percentage Change (2.6)% (1.3)% - 1.3 % 2.6 %
Futures
Market Value (35,383) (17,456) - 16,991 33,522
Percentage Change (0.8)% (0.4)% - 0.4 % 0.8 %
Net Gain/(Loss) $ 77,096 $ 44,753 - $ (51,953) $ (108,414)
Percentage Change
in Portfolio Value(1) 1.8 % 1.1 % - (1.2)% (2.6)% Near Term 0-3
Short Term 3-5
Medium Term 5-10
Long Term 10-30
Hedge Book Maturities
36%
58%
6%
INTEREST RATE SENSITIVITY
Chimera continues to reduce its rate exposure by reducing its Agency portfolio and hedges
Total Notional Balance - Derivative Instruments
December 31, 2016 September 30, 2016
Interest Rate Swaps 1,396,900 1,380,900
Swaptions 624,000 699,000
Futures 619,700 619,700
(1) Based on instantaneous moves in interest rates.

chimerareit.com