EX-99.2
Published on August 4, 2021
FINANCIAL SUPPLEMENT 2nd Quarter 2021
Information is unaudited, estimated and subject to change. DISCLAIMER This presentation includes “forward-looking statements” within the meaning of the safe harbor provisions of the United States Private Securities Litigation Reform Act of 1995. Actual results may differ from expectations, estimates and projections and, consequently, readers should not rely on these forward-looking statements as predictions of future events. Words such as “goal” “expect,” “target,” “assume,” “estimate,” “project,” “budget,” “forecast,” “anticipate,” “intend,” “plan,” “may,” “will,” “could,” “should,” “believe,” “predicts,” “potential,” “continue,” and similar expressions are intended to identify such forward-looking statements. These forward-looking statements involve significant risks and uncertainties that could cause actual results to differ materially from expected results, including, among other things, those described in our most recent Annual Report on Form 10-K, and any subsequent Quarterly Reports on Form 10-Q and Current Report on Form 8-K, under the caption “Risk Factors.” Factors that could cause actual results to differ include, but are not limited to:our business and investment strategy; our ability to accurately forecast the payment of future dividends on our common and preferred stock, and the amount of such dividends; our ability to determine accurately the fair market value of our assets; availability of investment opportunities in real estate-related and other securities, including our valuation of potential opportunities that may arise as a result of current and future market dislocations; effect of the novel coronavirus (or COVID-19) pandemic on real estate market, financial markets and our Company, including the impact on the value, availability, financing and liquidity of mortgage assets; how COVID-19 may affect us, our operations and our personnel; our expected investments; changes in the value of our investments, including negative changes resulting in margin calls related to the financing of our assets; changes in interest rates and mortgage prepayment rates; prepayments of the mortgage and other loans underlying our mortgage-backed securities, or RMBS, or other asset-backed securities, or ABS; rates of default, delinquencies or decreased recovery rates on our investments; general volatility of the securities markets in which we invest; our ability to maintain existing financing arrangements and our ability to obtain future financing arrangements; our ability to effect our strategy to securitize residential mortgage loans; interest rate mismatches between our investments and our borrowings used to finance such purchases; effects of interest rate caps on our adjustable-rate investments; the degree to which our hedging strategies may or may not protect us from interest rate volatility; the impact of and changes to various government programs, including in response to COVID-19; impact of and changes in governmental regulations, tax law and rates, accounting guidance, and similar matters; market trends in our industry, interest rates, the debt securities markets or the general economy; estimates relating to our ability to make distributions to our stockholders in the future; our understanding of our competition; availability of qualified personnel; our ability to maintain our classification as a real estate investment trust, or, REIT, for U.S. federal income tax purposes; our ability to maintain our exemption from registration under the Investment Company Act of 1940, as amended, or 1940 Act; our expectations regarding materiality or significance; and the effectiveness of our disclosure controls and procedures. Readers are cautioned not to place undue reliance upon any forward-looking statements, which speak only as of the date made. Chimera does not undertake or accept any obligation to release publicly any updates or revisions to any forward-looking statement to reflect any change in its expectations or any change in events, conditions or circumstances on which any such statement is based. Additional information concerning these and other risk factors is contained in Chimera’s most recent filings with the Securities and Exchange Commission (SEC). All subsequent written and oral forward-looking statements concerning Chimera or matters attributable to Chimera or any person acting on its behalf are expressly qualified in their entirety by the cautionary statements above. This presentation may include industry and market data obtained through research, surveys, and studies conducted by third parties and industry publications. We have not independently verified any such market and industry data from third-party sources. This presentation is provided for discussion purposes only and may not be relied upon as legal or investment advice, nor is it intended to be inclusive of all the risks and uncertainties that should be considered. This presentation does not constitute an offer to purchase or sell any securities, nor shall it be construed to be indicative of the terms of an offer that the parties or their respective affiliates would accept. Readers are advised that the financial information in this presentation is based on company data available at the time of this presentation and, in certain circumstances, may not have been audited by the company’s independent auditors.
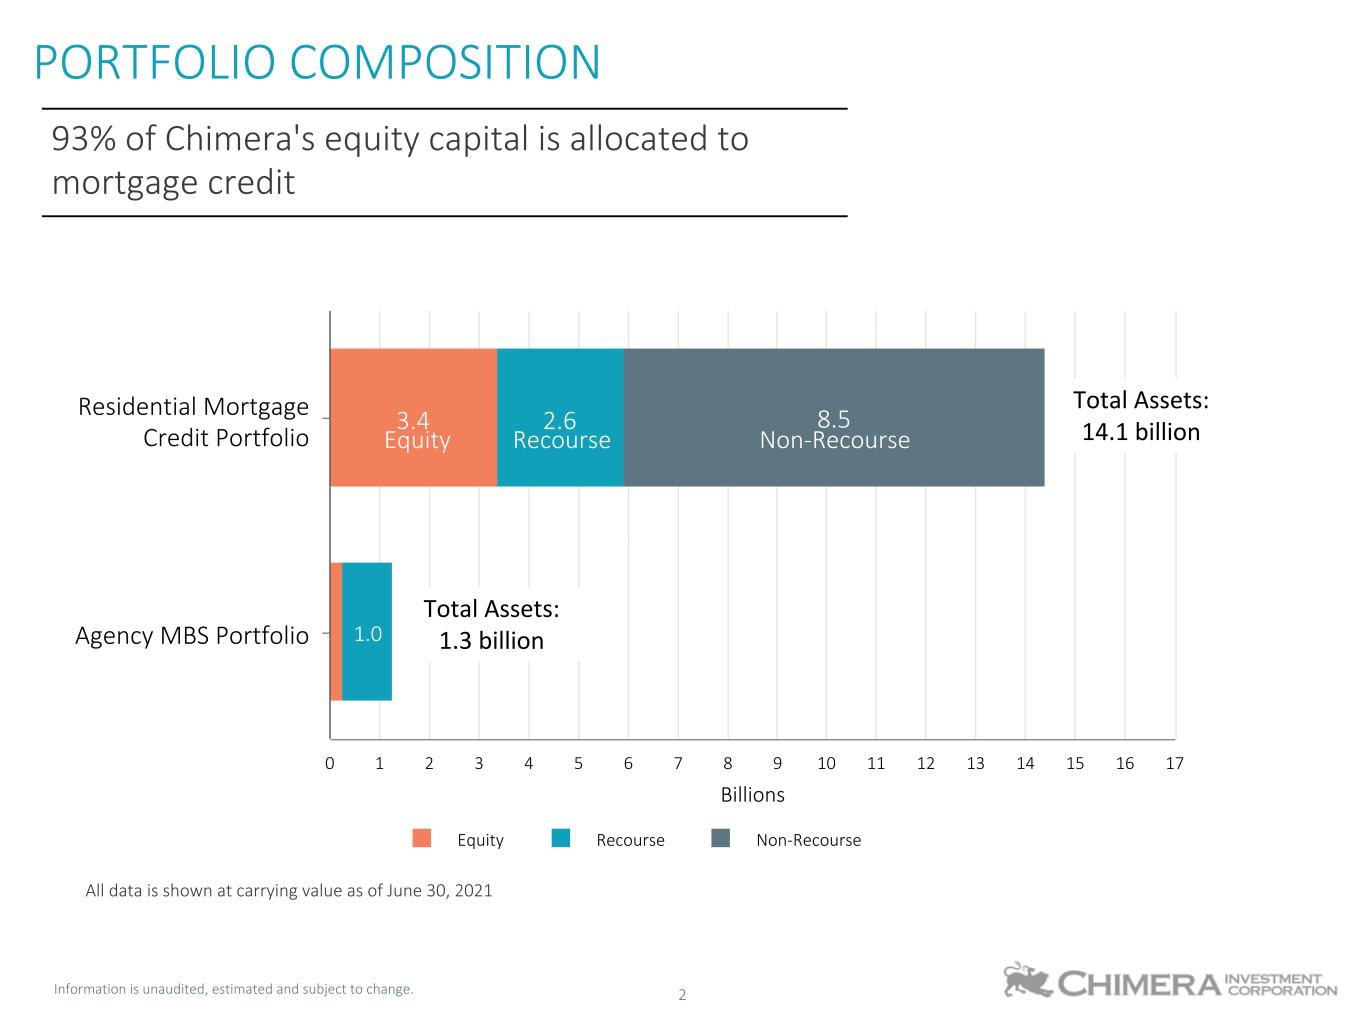
Information is unaudited, estimated and subject to change. 2 PORTFOLIO COMPOSITION 93% of Chimera's equity capital is allocated to mortgage credit Billions 3.4 2.6 1.0 8.5 Equity Recourse Non-Recourse Residential Mortgage Credit Portfolio Agency MBS Portfolio 0 1 2 3 4 5 6 7 8 9 10 11 12 13 14 15 16 17 Total Assets: 14.1 billion Total Assets: 1.3 billion All data is shown at carrying value as of June 30, 2021 Equity Recourse Non-Recourse
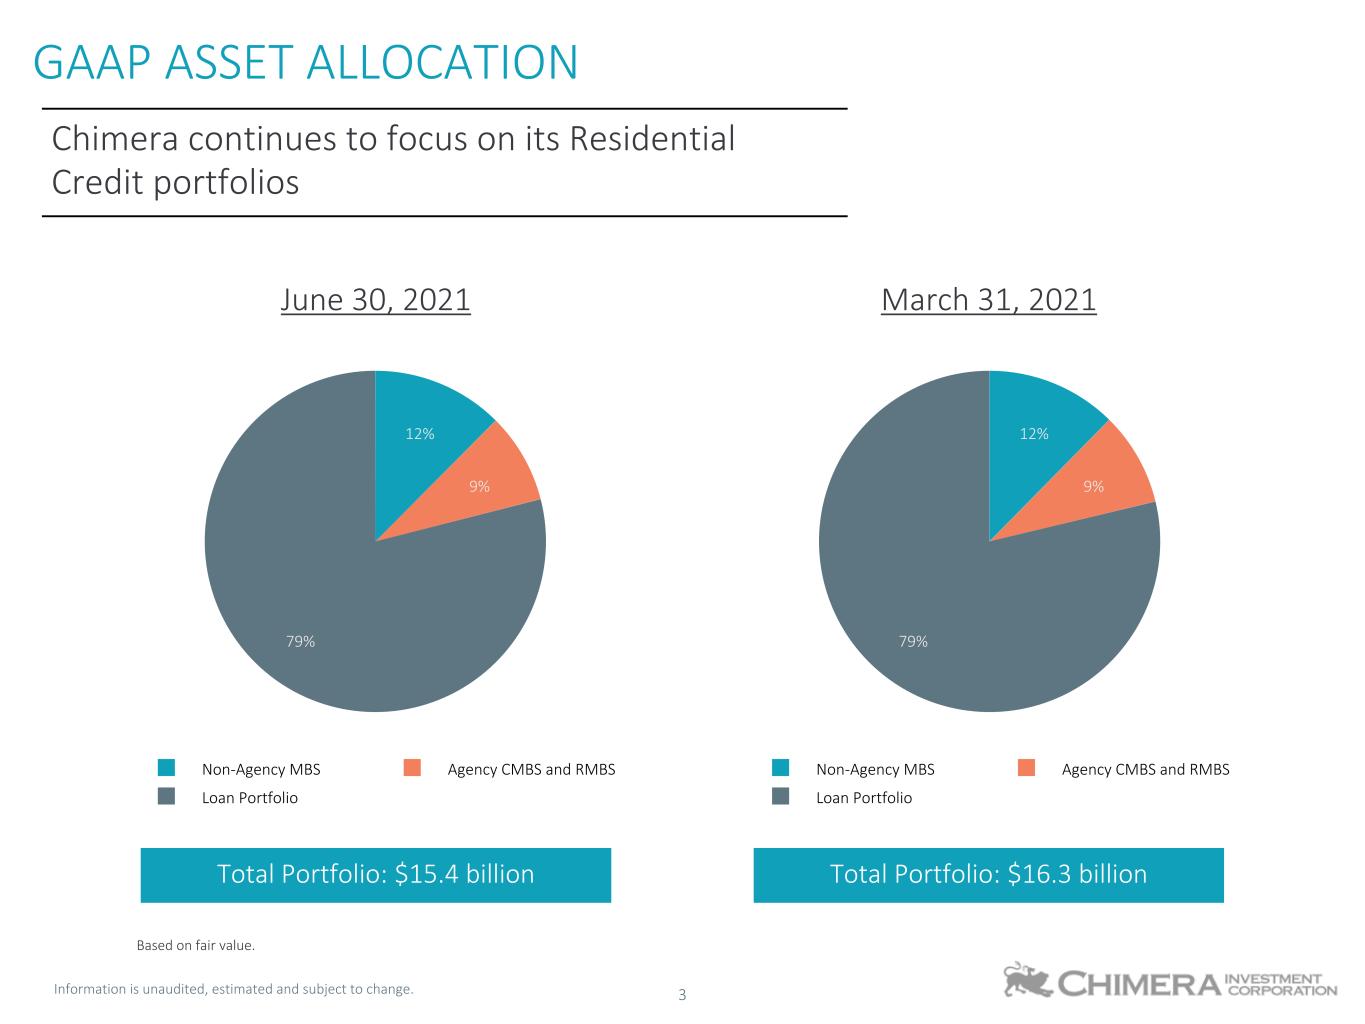
Information is unaudited, estimated and subject to change. 3 12% 9% 79% Non-Agency MBS Agency CMBS and RMBS Loan Portfolio GAAP ASSET ALLOCATION Based on fair value. 12% 9% 79% Non-Agency MBS Agency CMBS and RMBS Loan Portfolio June 30, 2021 March 31, 2021 Chimera continues to focus on its Residential Credit portfolios Total Portfolio: $15.4 billion Total Portfolio: $16.3 billion
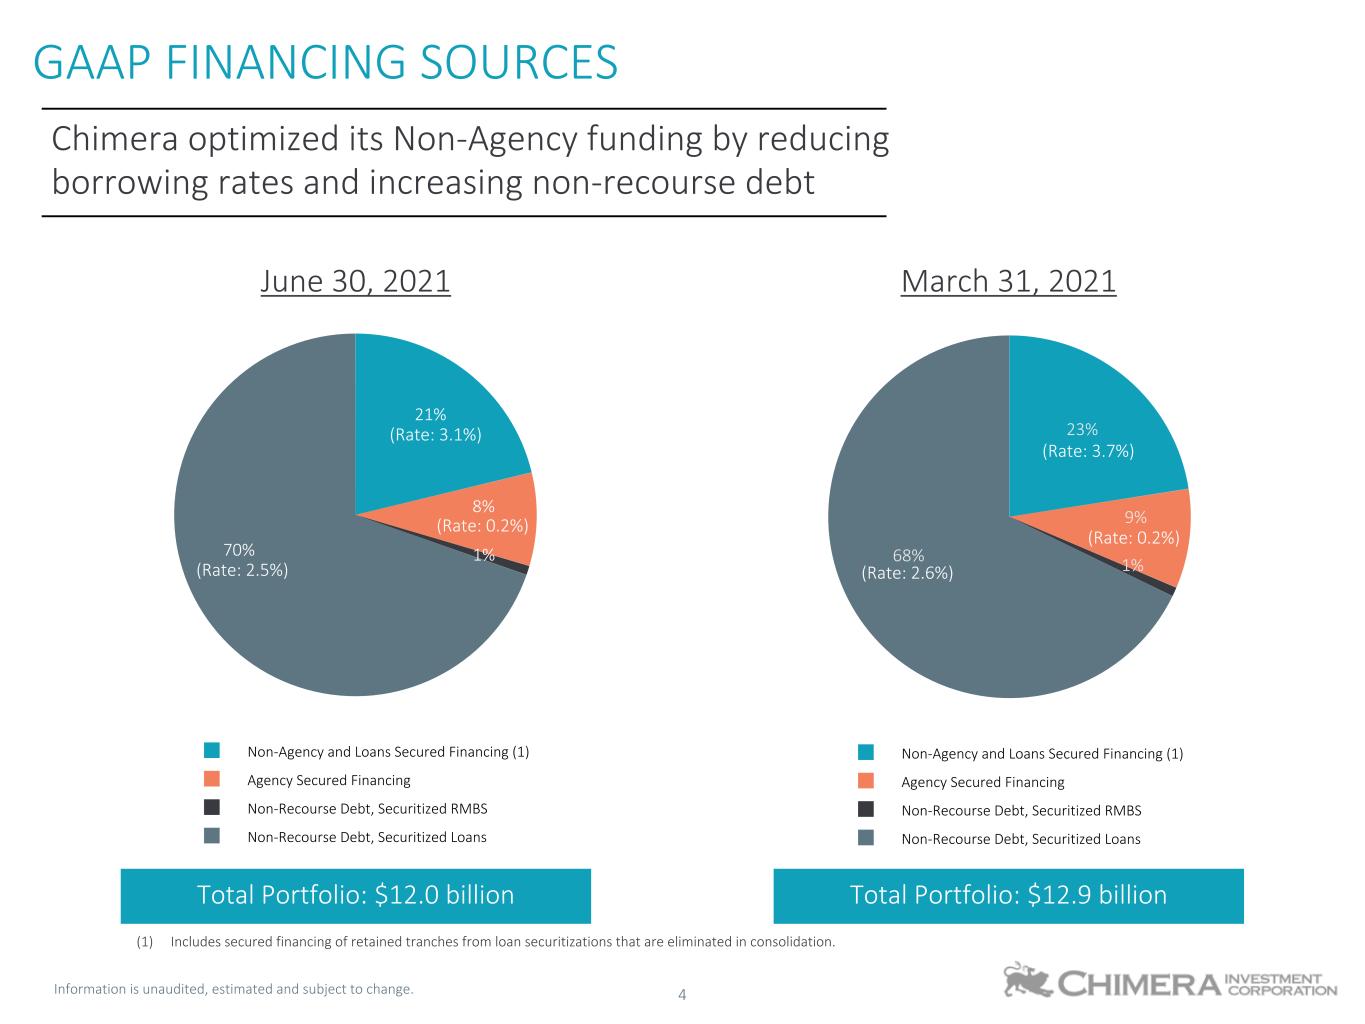
Information is unaudited, estimated and subject to change. 4 21% 8% 1%70% Non-Agency and Loans Secured Financing (1) Agency Secured Financing Non-Recourse Debt, Securitized RMBS Non-Recourse Debt, Securitized Loans GAAP FINANCING SOURCES 23% 9% 1%68% Non-Agency and Loans Secured Financing (1) Agency Secured Financing Non-Recourse Debt, Securitized RMBS Non-Recourse Debt, Securitized Loans (1) Includes secured financing of retained tranches from loan securitizations that are eliminated in consolidation. Chimera optimized its Non-Agency funding by reducing borrowing rates and increasing non-recourse debt June 30, 2021 March 31, 2021 Total Portfolio: $12.0 billion Total Portfolio: $12.9 billion (Rate: 2.5%) (Rate: 2.6%) (Rate: 0.2%) (Rate: 3.1%) (Rate: 0.2%) (Rate: 3.7%)
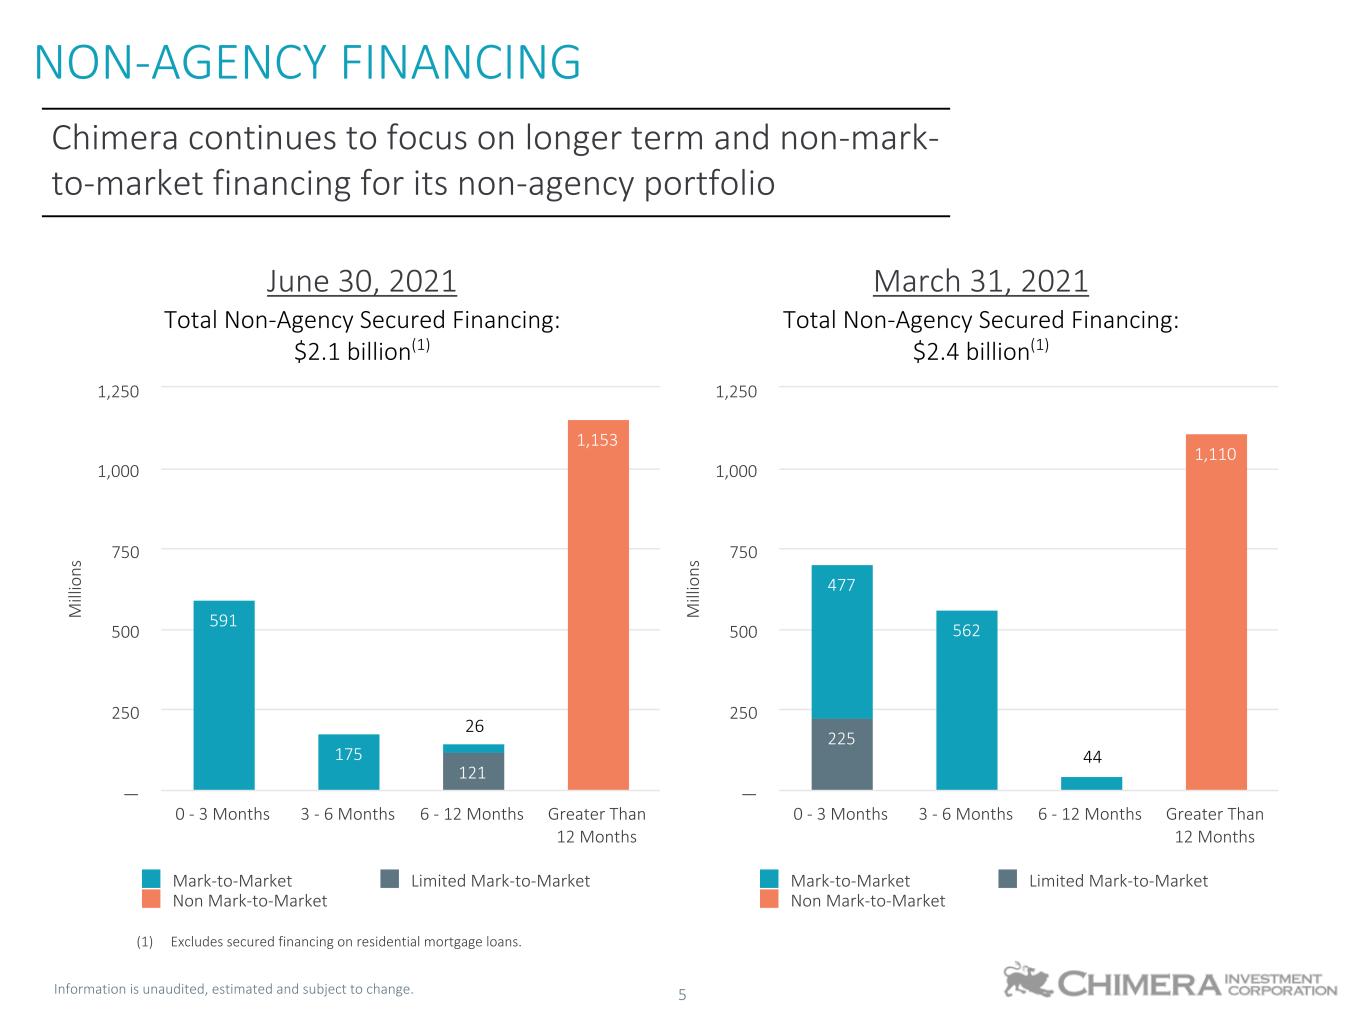
Information is unaudited, estimated and subject to change. 5 NON-AGENCY FINANCING Chimera continues to focus on longer term and non-mark- to-market financing for its non-agency portfolio M ill io ns 1,153 — 121 591 175 Mark-to-Market Limited Mark-to-Market Non Mark-to-Market 0 - 3 Months 3 - 6 Months 6 - 12 Months Greater Than 12 Months — 250 500 750 1,000 1,250 M ill io ns 1,110 225 477 562 Mark-to-Market Limited Mark-to-Market Non Mark-to-Market 0 - 3 Months 3 - 6 Months 6 - 12 Months Greater Than 12 Months — 250 500 750 1,000 1,250 June 30, 2021 March 31, 2021 Total Non-Agency Secured Financing: $2.1 billion(1) Total Non-Agency Secured Financing: $2.4 billion(1) (1) Excludes secured financing on residential mortgage loans. 44 26
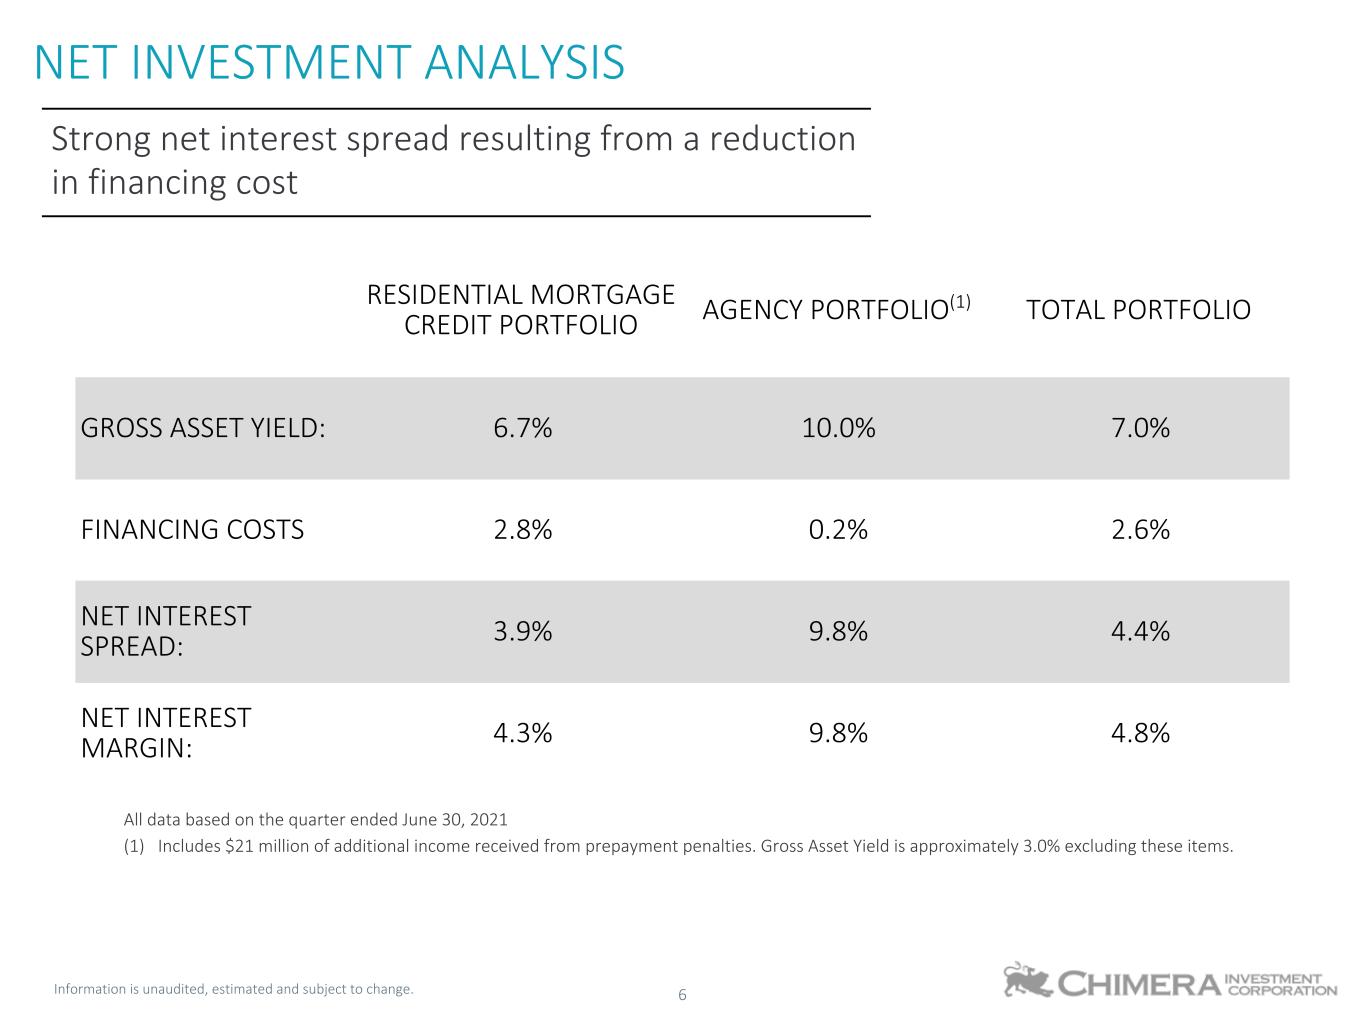
Information is unaudited, estimated and subject to change. 6 RESIDENTIAL MORTGAGE CREDIT PORTFOLIO AGENCY PORTFOLIO(1) TOTAL PORTFOLIO GROSS ASSET YIELD: 6.7% 10.0% 7.0% FINANCING COSTS 2.8% 0.2% 2.6% NET INTEREST SPREAD: 3.9% 9.8% 4.4% NET INTEREST MARGIN: 4.3% 9.8% 4.8% All data based on the quarter ended June 30, 2021 (1) Includes $21 million of additional income received from prepayment penalties. Gross Asset Yield is approximately 3.0% excluding these items. NET INVESTMENT ANALYSIS Strong net interest spread resulting from a reduction in financing cost
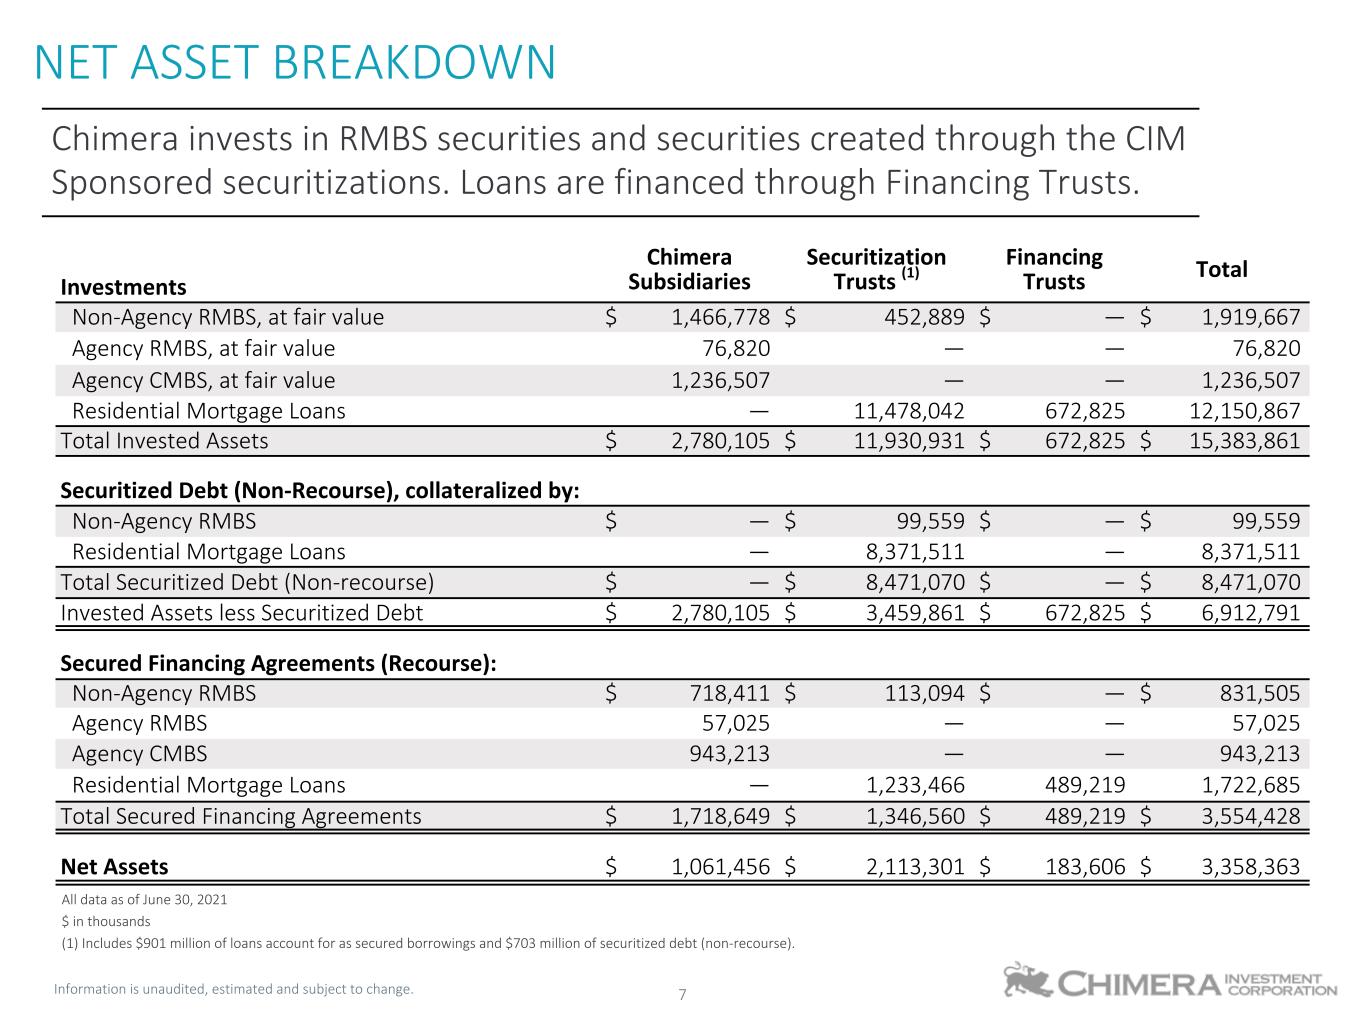
Information is unaudited, estimated and subject to change. 7 Chimera Subsidiaries Securitization Trusts (1) Financing Trusts Total Investments Non-Agency RMBS, at fair value $ 1,466,778 $ 452,889 $ — $ 1,919,667 Agency RMBS, at fair value 76,820 — — 76,820 Agency CMBS, at fair value 1,236,507 — — 1,236,507 Residential Mortgage Loans — 11,478,042 672,825 12,150,867 Total Invested Assets $ 2,780,105 $ 11,930,931 $ 672,825 $ 15,383,861 Securitized Debt (Non-Recourse), collateralized by: Non-Agency RMBS $ — $ 99,559 $ — $ 99,559 Residential Mortgage Loans — 8,371,511 — 8,371,511 Total Securitized Debt (Non-recourse) $ — $ 8,471,070 $ — $ 8,471,070 Invested Assets less Securitized Debt $ 2,780,105 $ 3,459,861 $ 672,825 $ 6,912,791 Secured Financing Agreements (Recourse): Non-Agency RMBS $ 718,411 $ 113,094 $ — $ 831,505 Agency RMBS 57,025 — — 57,025 Agency CMBS 943,213 — — 943,213 Residential Mortgage Loans — 1,233,466 489,219 1,722,685 Total Secured Financing Agreements $ 1,718,649 $ 1,346,560 $ 489,219 $ 3,554,428 Net Assets $ 1,061,456 $ 2,113,301 $ 183,606 $ 3,358,363 All data as of June 30, 2021 $ in thousands (1) Includes $901 million of loans account for as secured borrowings and $703 million of securitized debt (non-recourse). NET ASSET BREAKDOWN Chimera invests in RMBS securities and securities created through the CIM Sponsored securitizations. Loans are financed through Financing Trusts.
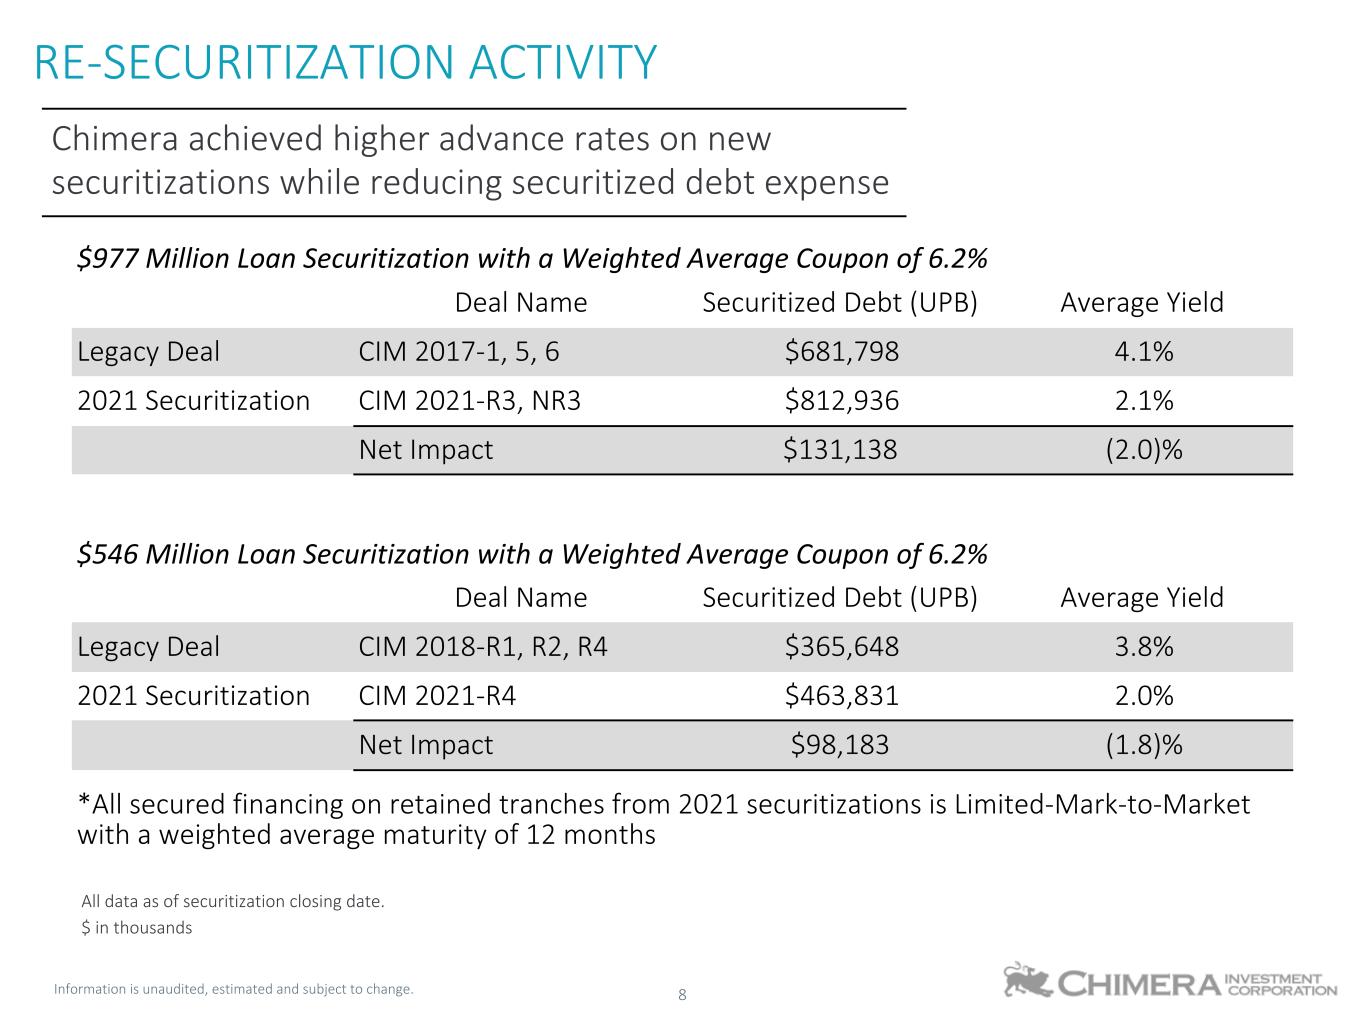
Information is unaudited, estimated and subject to change. 8 $977 Million Loan Securitization with a Weighted Average Coupon of 6.2% Deal Name Securitized Debt (UPB) Average Yield Legacy Deal CIM 2017-1, 5, 6 $681,798 4.1% 2021 Securitization CIM 2021-R3, NR3 $812,936 2.1% Net Impact $131,138 (2.0)% $546 Million Loan Securitization with a Weighted Average Coupon of 6.2% Deal Name Securitized Debt (UPB) Average Yield Legacy Deal CIM 2018-R1, R2, R4 $365,648 3.8% 2021 Securitization CIM 2021-R4 $463,831 2.0% Net Impact $98,183 (1.8)% *All secured financing on retained tranches from 2021 securitizations is Limited-Mark-to-Market with a weighted average maturity of 12 months RE-SECURITIZATION ACTIVITY Chimera achieved higher advance rates on new securitizations while reducing securitized debt expense All data as of securitization closing date. $ in thousands
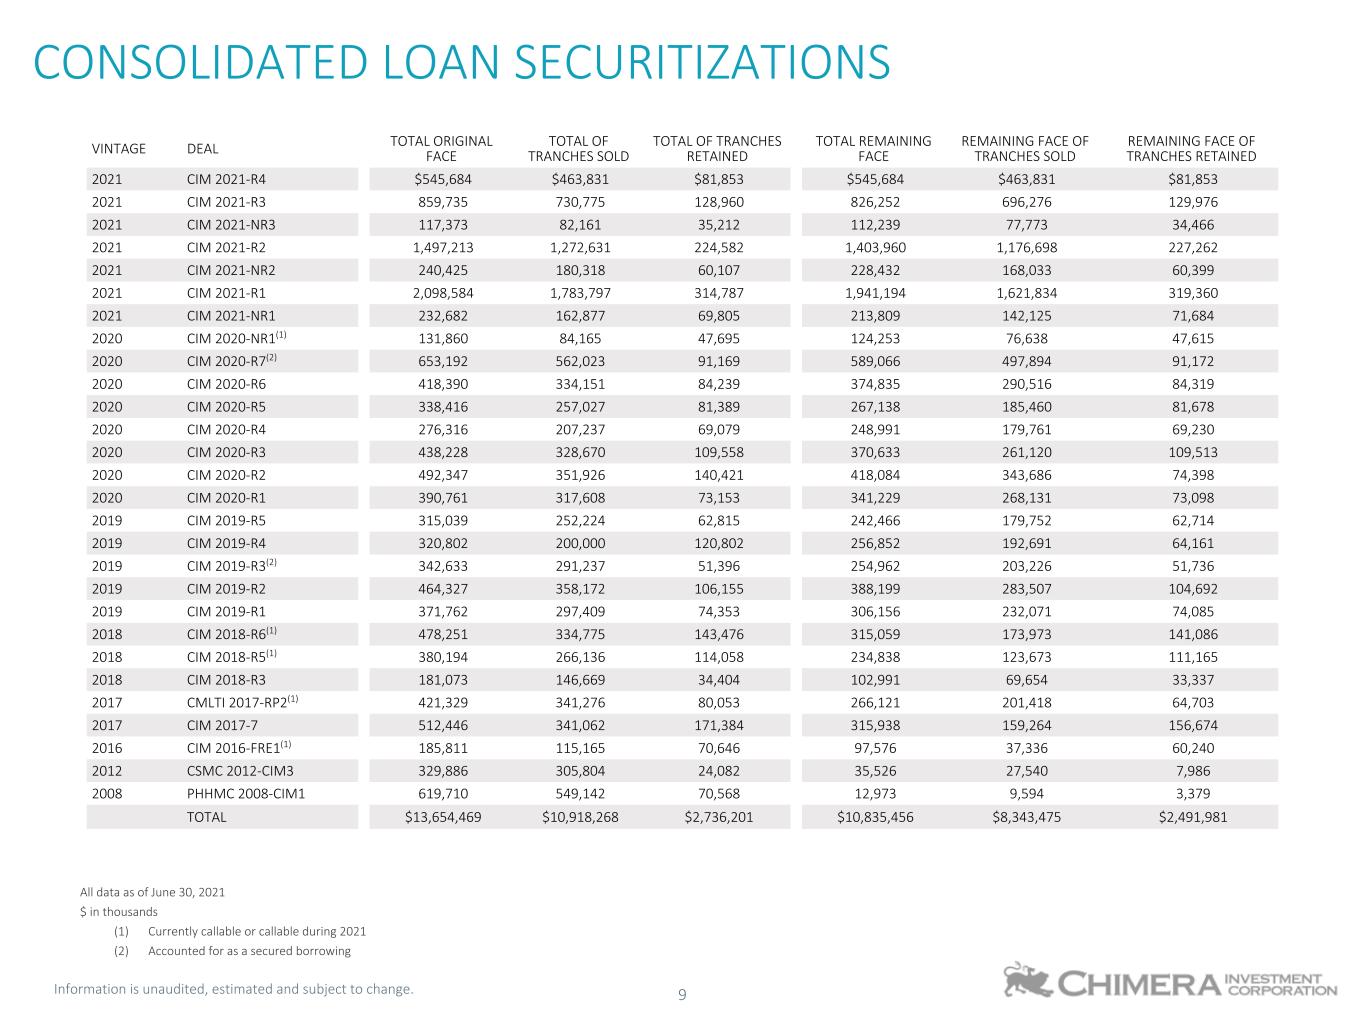
Information is unaudited, estimated and subject to change. 9 VINTAGE DEAL TOTAL ORIGINAL FACE TOTAL OF TRANCHES SOLD TOTAL OF TRANCHES RETAINED TOTAL REMAINING FACE REMAINING FACE OF TRANCHES SOLD REMAINING FACE OF TRANCHES RETAINED 2021 CIM 2021-R4 $545,684 $463,831 $81,853 $545,684 $463,831 $81,853 2021 CIM 2021-R3 859,735 730,775 128,960 826,252 696,276 129,976 2021 CIM 2021-NR3 117,373 82,161 35,212 112,239 77,773 34,466 2021 CIM 2021-R2 1,497,213 1,272,631 224,582 1,403,960 1,176,698 227,262 2021 CIM 2021-NR2 240,425 180,318 60,107 228,432 168,033 60,399 2021 CIM 2021-R1 2,098,584 1,783,797 314,787 1,941,194 1,621,834 319,360 2021 CIM 2021-NR1 232,682 162,877 69,805 213,809 142,125 71,684 2020 CIM 2020-NR1(1) 131,860 84,165 47,695 124,253 76,638 47,615 2020 CIM 2020-R7(2) 653,192 562,023 91,169 589,066 497,894 91,172 2020 CIM 2020-R6 418,390 334,151 84,239 374,835 290,516 84,319 2020 CIM 2020-R5 338,416 257,027 81,389 267,138 185,460 81,678 2020 CIM 2020-R4 276,316 207,237 69,079 248,991 179,761 69,230 2020 CIM 2020-R3 438,228 328,670 109,558 370,633 261,120 109,513 2020 CIM 2020-R2 492,347 351,926 140,421 418,084 343,686 74,398 2020 CIM 2020-R1 390,761 317,608 73,153 341,229 268,131 73,098 2019 CIM 2019-R5 315,039 252,224 62,815 242,466 179,752 62,714 2019 CIM 2019-R4 320,802 200,000 120,802 256,852 192,691 64,161 2019 CIM 2019-R3(2) 342,633 291,237 51,396 254,962 203,226 51,736 2019 CIM 2019-R2 464,327 358,172 106,155 388,199 283,507 104,692 2019 CIM 2019-R1 371,762 297,409 74,353 306,156 232,071 74,085 2018 CIM 2018-R6(1) 478,251 334,775 143,476 315,059 173,973 141,086 2018 CIM 2018-R5(1) 380,194 266,136 114,058 234,838 123,673 111,165 2018 CIM 2018-R3 181,073 146,669 34,404 102,991 69,654 33,337 2017 CMLTI 2017-RP2(1) 421,329 341,276 80,053 266,121 201,418 64,703 2017 CIM 2017-7 512,446 341,062 171,384 315,938 159,264 156,674 2016 CIM 2016-FRE1(1) 185,811 115,165 70,646 97,576 37,336 60,240 2012 CSMC 2012-CIM3 329,886 305,804 24,082 35,526 27,540 7,986 2008 PHHMC 2008-CIM1 619,710 549,142 70,568 12,973 9,594 3,379 TOTAL $13,654,469 $10,918,268 $2,736,201 $10,835,456 $8,343,475 $2,491,981 All data as of June 30, 2021 $ in thousands (1) Currently callable or callable during 2021 (2) Accounted for as a secured borrowing CONSOLIDATED LOAN SECURITIZATIONS
chimerareit.com