EX-99.2
Published on February 17, 2022
FINANCIAL SUPPLEMENT 4th Quarter 2021
Information is unaudited, estimated and subject to change. DISCLAIMER This presentation includes “forward-looking statements” within the meaning of the safe harbor provisions of the United States Private Securities Litigation Reform Act of 1995. Actual results may differ from expectations, estimates and projections and, consequently, readers should not rely on these forward-looking statements as predictions of future events. Words such as “goal” “expect,” “target,” “assume,” “estimate,” “project,” “budget,” “forecast,” “anticipate,” “intend,” “plan,” “may,” “will,” “could,” “should,” “believe,” “predicts,” “potential,” “continue,” and similar expressions are intended to identify such forward-looking statements. These forward-looking statements involve significant risks and uncertainties that could cause actual results to differ materially from expected results, including, among other things, those described in our most recent Annual Report on Form 10-K, and any subsequent Quarterly Reports on Form 10-Q and Current Report on Form 8-K, under the caption “Risk Factors.” Factors that could cause actual results to differ include, but are not limited to:our business and investment strategy; our ability to accurately forecast the payment of future dividends on our common and preferred stock, and the amount of such dividends; our ability to determine accurately the fair market value of our assets; availability of investment opportunities in real estate-related and other securities, including our valuation of potential opportunities that may arise as a result of current and future market dislocations; effect of the novel coronavirus (or COVID-19) pandemic on real estate market, financial markets and our Company, including the impact on the value, availability, financing and liquidity of mortgage assets; how COVID-19 may affect us, our operations and our personnel; our expected investments; changes in the value of our investments, including negative changes resulting in margin calls related to the financing of our assets; changes in interest rates and mortgage prepayment rates; prepayments of the mortgage and other loans underlying our mortgage-backed securities, or RMBS, or other asset-backed securities, or ABS; rates of default, delinquencies or decreased recovery rates on our investments; general volatility of the securities markets in which we invest; our ability to maintain existing financing arrangements and our ability to obtain future financing arrangements; our ability to effect our strategy to securitize residential mortgage loans; interest rate mismatches between our investments and our borrowings used to finance such purchases; effects of interest rate caps on our adjustable-rate investments; the degree to which our hedging strategies may or may not protect us from interest rate volatility; the impact of and changes to various government programs, including in response to COVID-19; impact of and changes in governmental regulations, tax law and rates, accounting guidance, and similar matters; market trends in our industry, interest rates, the debt securities markets or the general economy; estimates relating to our ability to make distributions to our stockholders in the future; our understanding of our competition; availability of qualified personnel; our ability to maintain our classification as a real estate investment trust, or, REIT, for U.S. federal income tax purposes; our ability to maintain our exemption from registration under the Investment Company Act of 1940, as amended, or 1940 Act; our expectations regarding materiality or significance; and the effectiveness of our disclosure controls and procedures. Readers are cautioned not to place undue reliance upon any forward-looking statements, which speak only as of the date made. Chimera does not undertake or accept any obligation to release publicly any updates or revisions to any forward-looking statement to reflect any change in its expectations or any change in events, conditions or circumstances on which any such statement is based. Additional information concerning these and other risk factors is contained in Chimera’s most recent filings with the Securities and Exchange Commission (SEC). All subsequent written and oral forward-looking statements concerning Chimera or matters attributable to Chimera or any person acting on its behalf are expressly qualified in their entirety by the cautionary statements above. This presentation may include industry and market data obtained through research, surveys, and studies conducted by third parties and industry publications. We have not independently verified any such market and industry data from third-party sources. This presentation is provided for discussion purposes only and may not be relied upon as legal or investment advice, nor is it intended to be inclusive of all the risks and uncertainties that should be considered. This presentation does not constitute an offer to purchase or sell any securities, nor shall it be construed to be indicative of the terms of an offer that the parties or their respective affiliates would accept. Readers are advised that the financial information in this presentation is based on company data available at the time of this presentation and, in certain circumstances, may not have been audited by the company’s independent auditors.
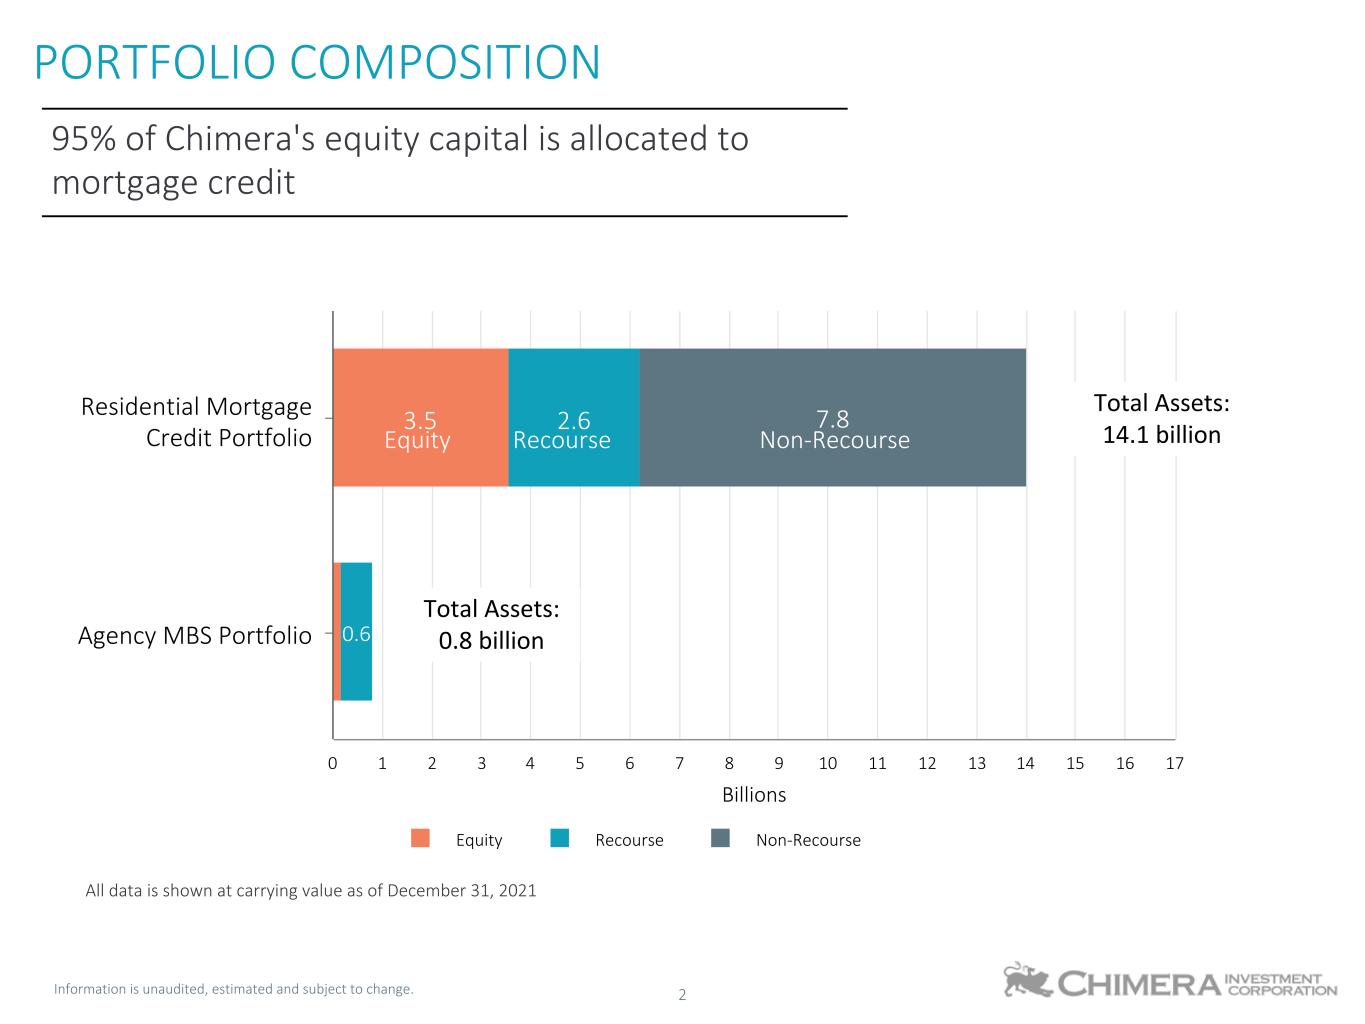
Information is unaudited, estimated and subject to change. 2 PORTFOLIO COMPOSITION 95% of Chimera's equity capital is allocated to mortgage credit Billions 3.5 2.6 0.6 7.8 Equity Recourse Non-Recourse Residential Mortgage Credit Portfolio Agency MBS Portfolio 0 1 2 3 4 5 6 7 8 9 10 11 12 13 14 15 16 17 Total Assets: 14.1 billion Total Assets: 0.8 billion All data is shown at carrying value as of December 31, 2021 Equity Recourse Non-Recourse
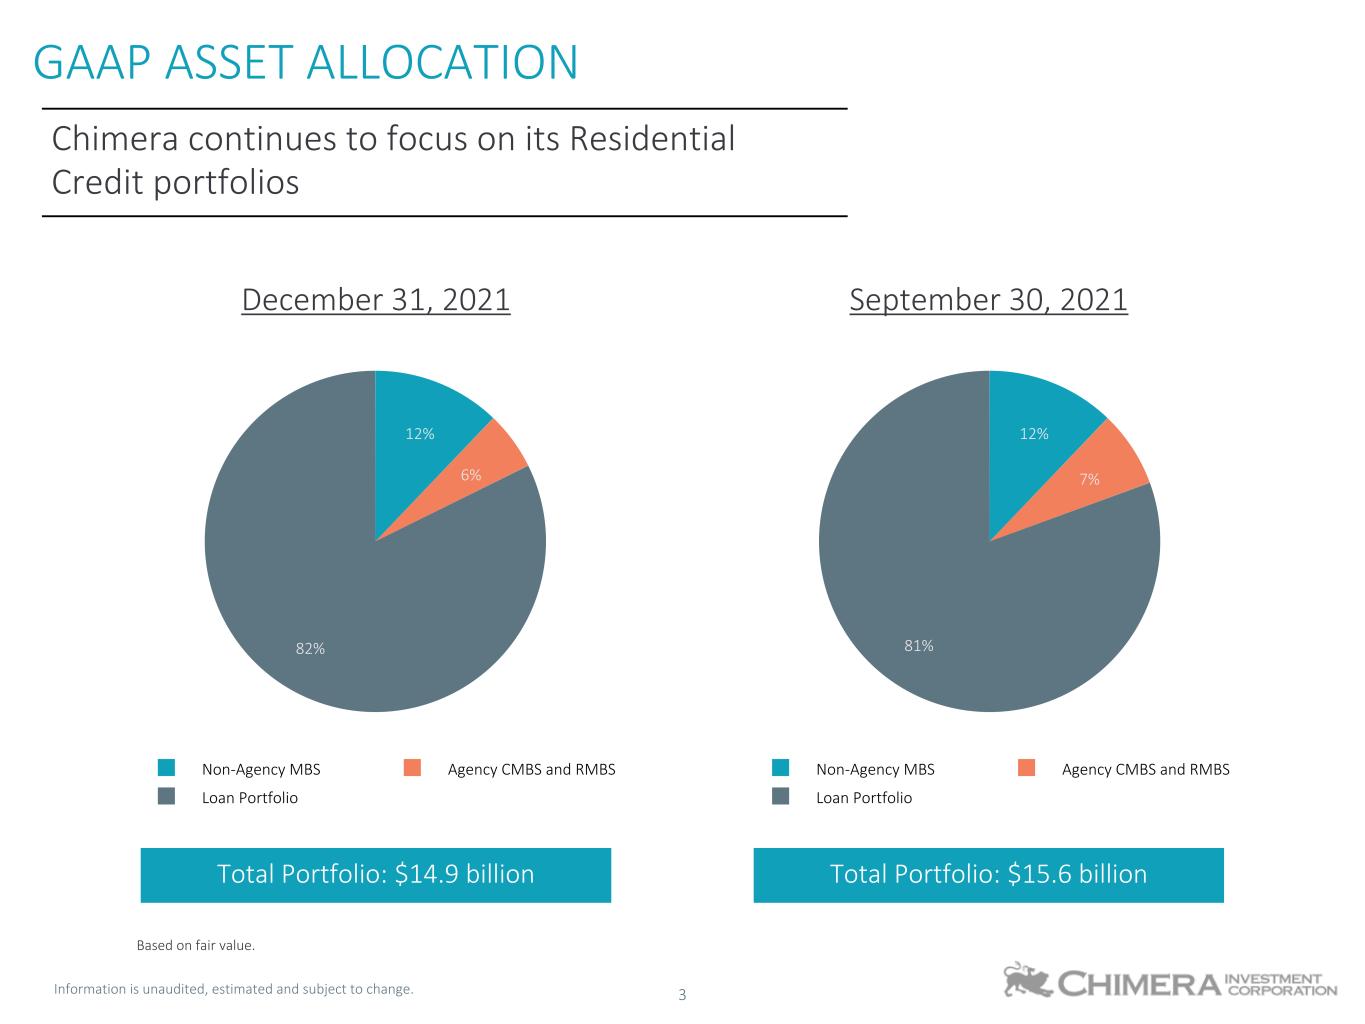
Information is unaudited, estimated and subject to change. 3 12% 6% 82% Non-Agency MBS Agency CMBS and RMBS Loan Portfolio GAAP ASSET ALLOCATION Based on fair value. 12% 7% 81% Non-Agency MBS Agency CMBS and RMBS Loan Portfolio December 31, 2021 September 30, 2021 Chimera continues to focus on its Residential Credit portfolios Total Portfolio: $14.9 billion Total Portfolio: $15.6 billion
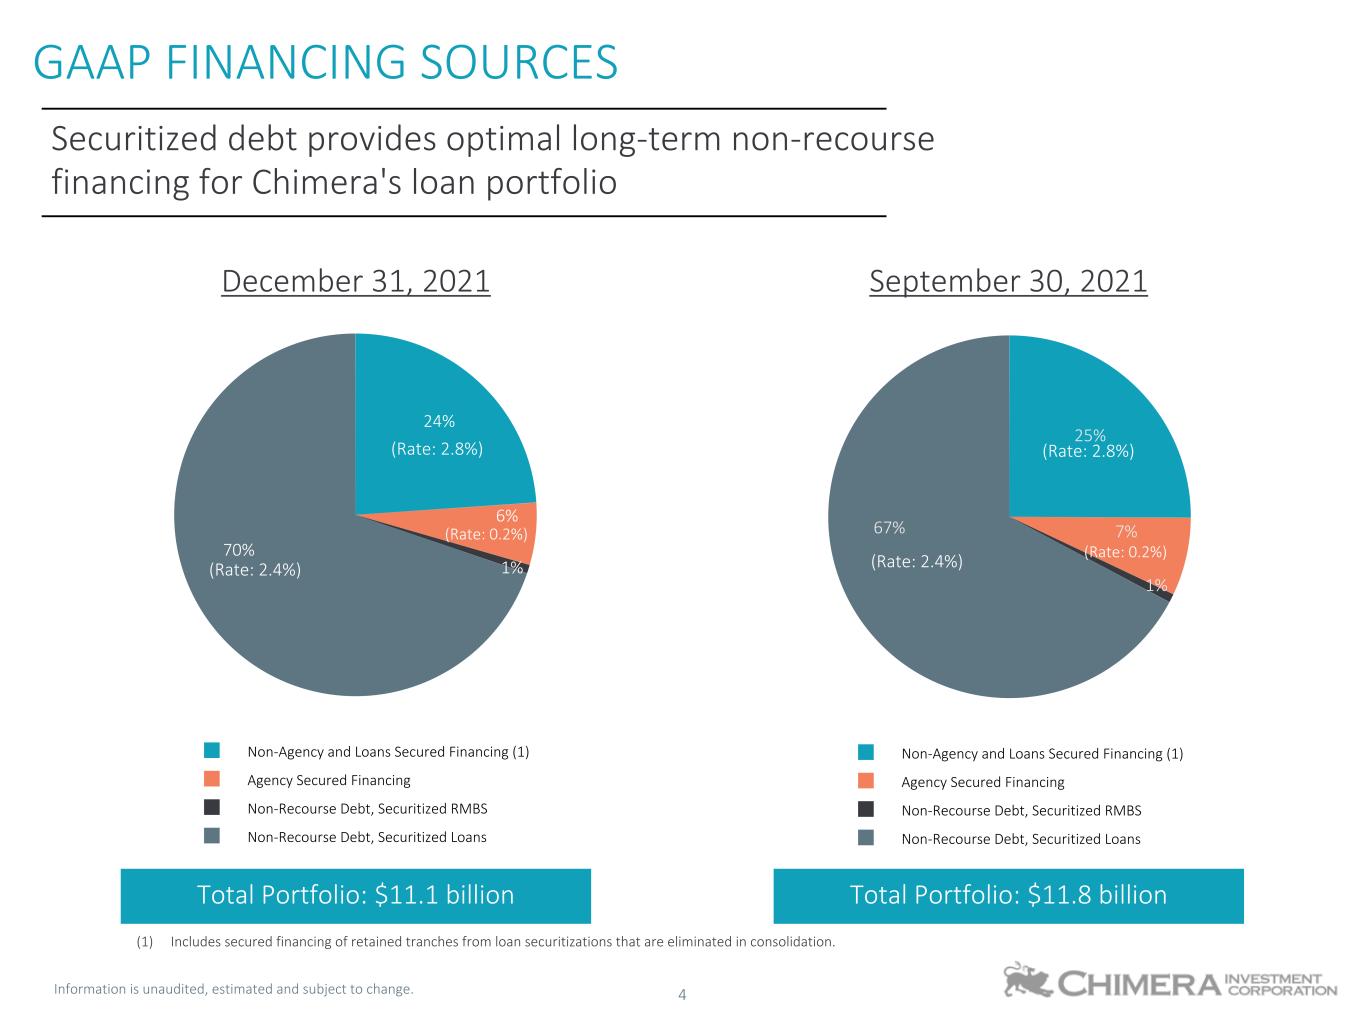
Information is unaudited, estimated and subject to change. 4 24% 6% 1% 70% Non-Agency and Loans Secured Financing (1) Agency Secured Financing Non-Recourse Debt, Securitized RMBS Non-Recourse Debt, Securitized Loans GAAP FINANCING SOURCES 25% 7% 1% 67% Non-Agency and Loans Secured Financing (1) Agency Secured Financing Non-Recourse Debt, Securitized RMBS Non-Recourse Debt, Securitized Loans (1) Includes secured financing of retained tranches from loan securitizations that are eliminated in consolidation. Securitized debt provides optimal long-term non-recourse financing for Chimera's loan portfolio December 31, 2021 September 30, 2021 Total Portfolio: $11.1 billion Total Portfolio: $11.8 billion (Rate: 2.4%) (Rate: 2.4%) (Rate: 0.2%) (Rate: 2.8%) (Rate: 0.2%) (Rate: 2.8%)
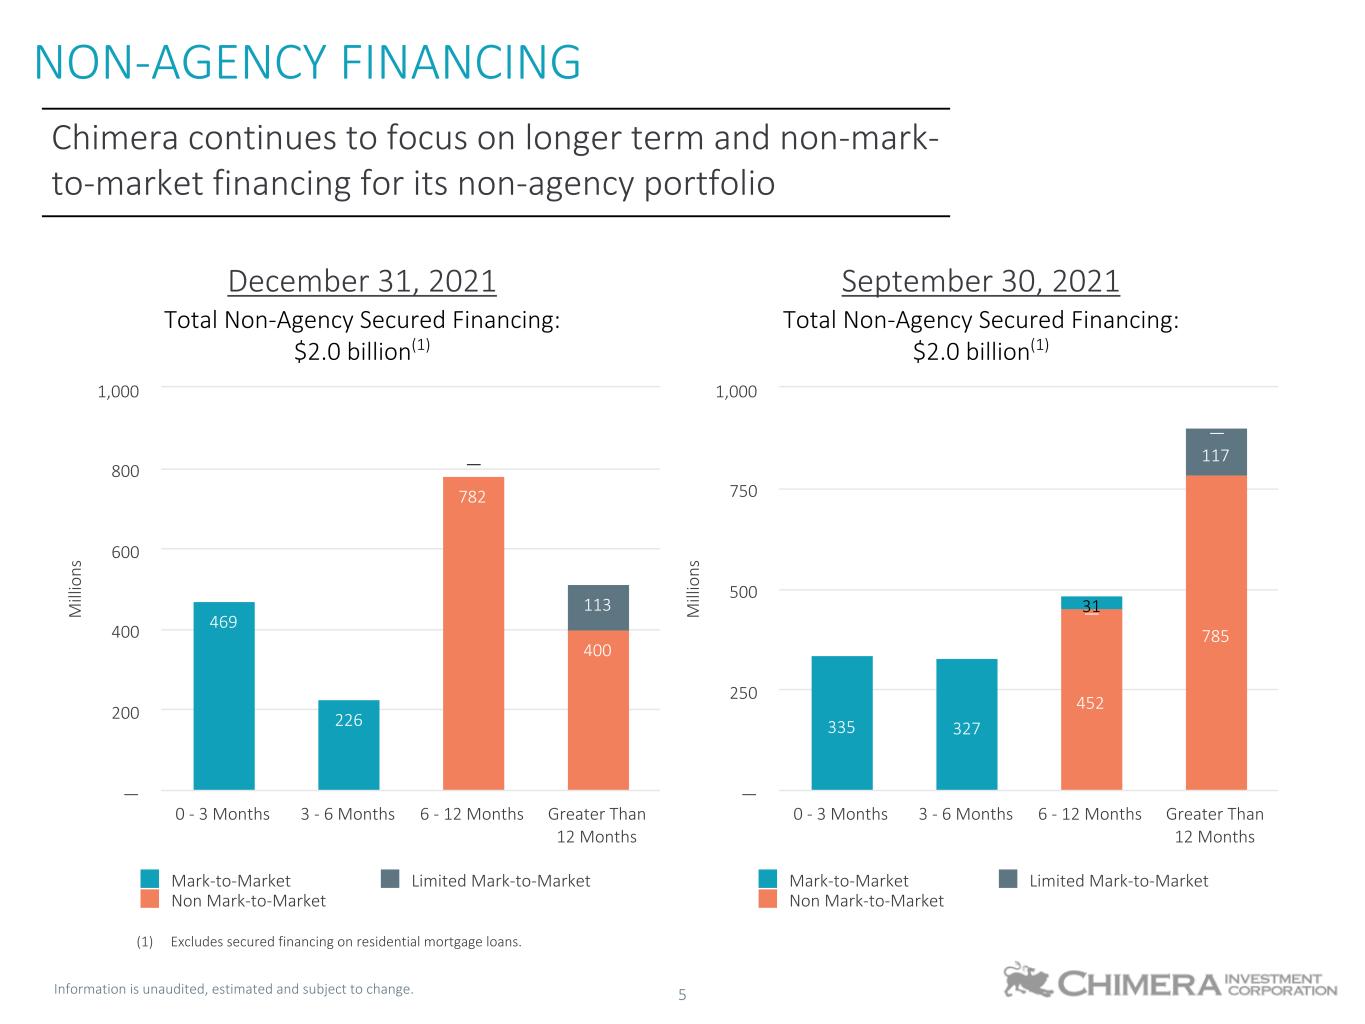
Information is unaudited, estimated and subject to change. 5 NON-AGENCY FINANCING Chimera continues to focus on longer term and non-mark- to-market financing for its non-agency portfolio M ill io ns 782 400 — — 113 469 226 — Mark-to-Market Limited Mark-to-Market Non Mark-to-Market 0 - 3 Months 3 - 6 Months 6 - 12 Months Greater Than 12 Months — 200 400 600 800 1,000 M ill io ns — — 452 785 — 117 335 327 31 — Mark-to-Market Limited Mark-to-Market Non Mark-to-Market 0 - 3 Months 3 - 6 Months 6 - 12 Months Greater Than 12 Months — 250 500 750 1,000 December 31, 2021 September 30, 2021 Total Non-Agency Secured Financing: $2.0 billion(1) Total Non-Agency Secured Financing: $2.0 billion(1) (1) Excludes secured financing on residential mortgage loans.
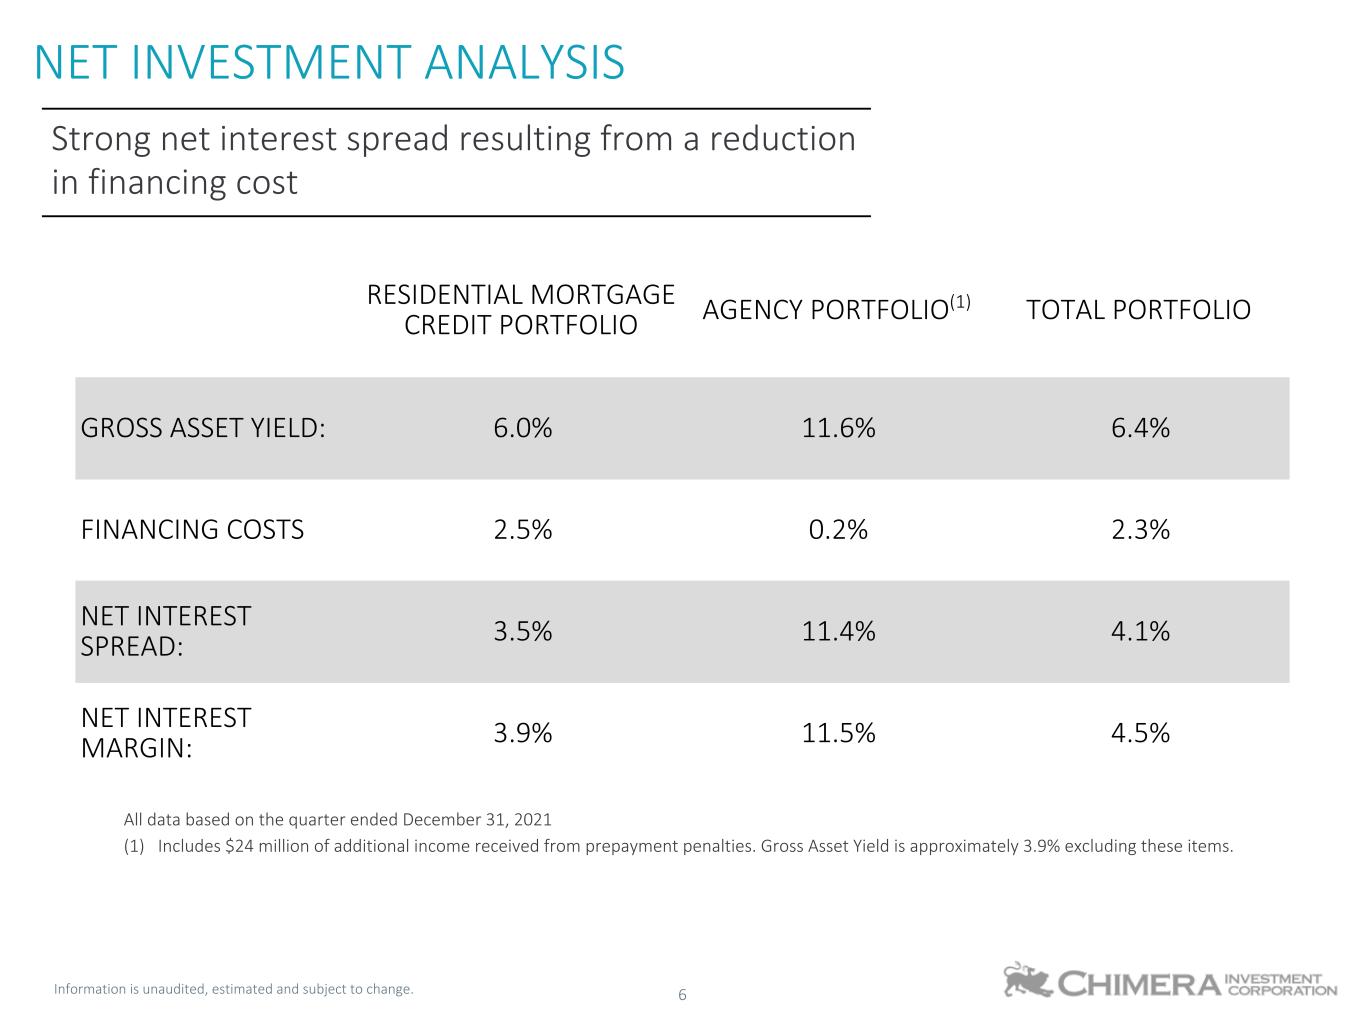
Information is unaudited, estimated and subject to change. 6 RESIDENTIAL MORTGAGE CREDIT PORTFOLIO AGENCY PORTFOLIO(1) TOTAL PORTFOLIO GROSS ASSET YIELD: 6.0% 11.6% 6.4% FINANCING COSTS 2.5% 0.2% 2.3% NET INTEREST SPREAD: 3.5% 11.4% 4.1% NET INTEREST MARGIN: 3.9% 11.5% 4.5% All data based on the quarter ended December 31, 2021 (1) Includes $24 million of additional income received from prepayment penalties. Gross Asset Yield is approximately 3.9% excluding these items. NET INVESTMENT ANALYSIS Strong net interest spread resulting from a reduction in financing cost
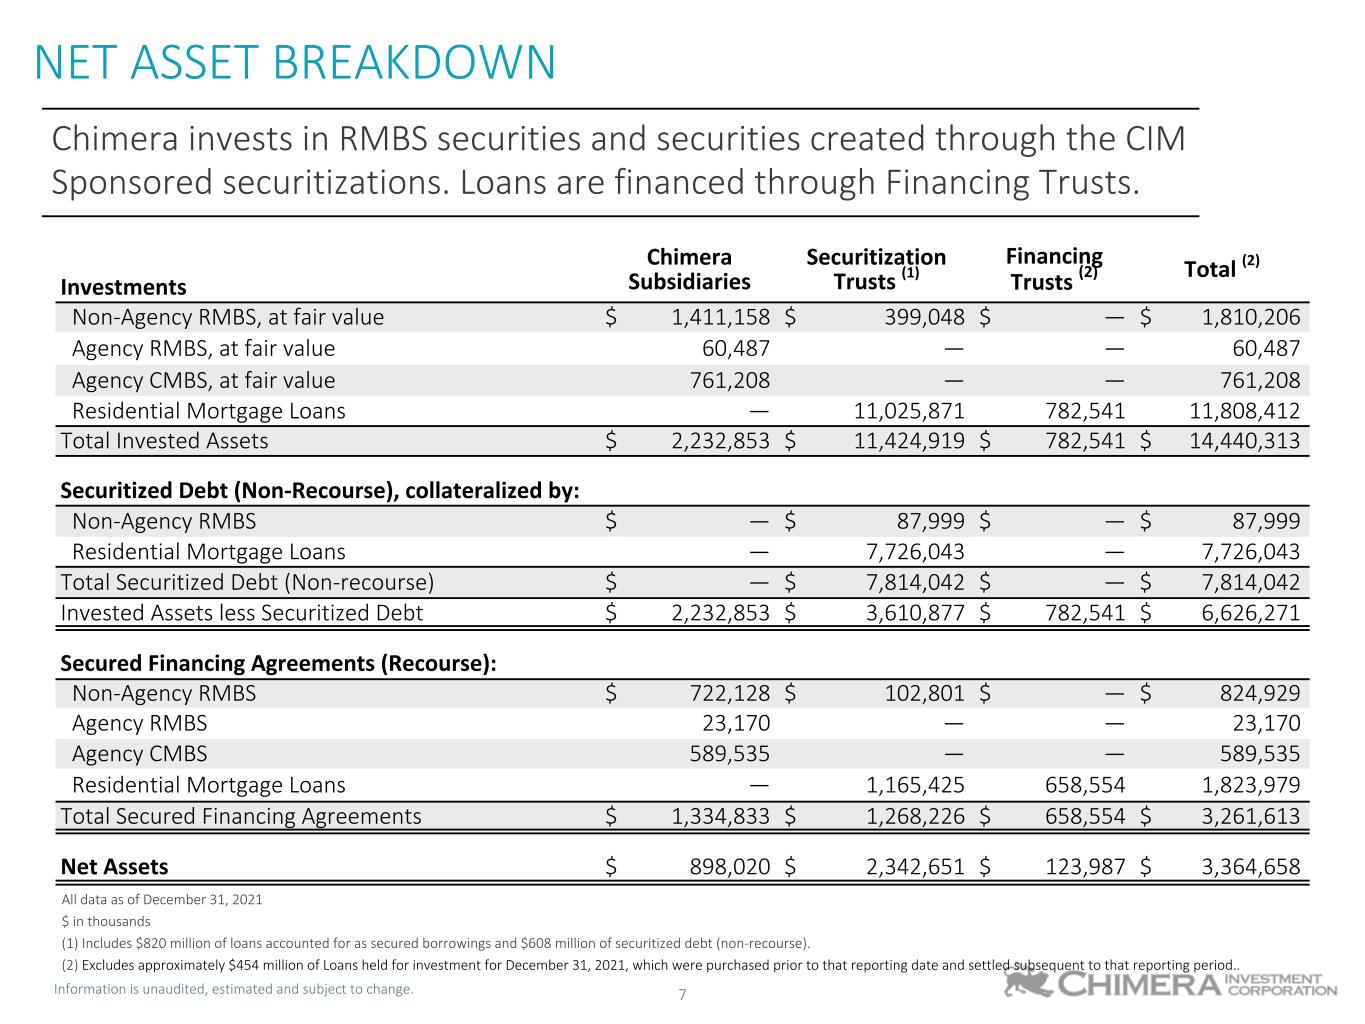
Information is unaudited, estimated and subject to change. 7 Chimera Subsidiaries Securitization Trusts (1) Financing Trusts (2) Total (2) Investments Non-Agency RMBS, at fair value $ 1,411,158 $ 399,048 $ — $ 1,810,206 Agency RMBS, at fair value 60,487 — — 60,487 Agency CMBS, at fair value 761,208 — — 761,208 Residential Mortgage Loans — 11,025,871 782,541 11,808,412 Total Invested Assets $ 2,232,853 $ 11,424,919 $ 782,541 $ 14,440,313 Securitized Debt (Non-Recourse), collateralized by: Non-Agency RMBS $ — $ 87,999 $ — $ 87,999 Residential Mortgage Loans — 7,726,043 — 7,726,043 Total Securitized Debt (Non-recourse) $ — $ 7,814,042 $ — $ 7,814,042 Invested Assets less Securitized Debt $ 2,232,853 $ 3,610,877 $ 782,541 $ 6,626,271 Secured Financing Agreements (Recourse): Non-Agency RMBS $ 722,128 $ 102,801 $ — $ 824,929 Agency RMBS 23,170 — — 23,170 Agency CMBS 589,535 — — 589,535 Residential Mortgage Loans — 1,165,425 658,554 1,823,979 Total Secured Financing Agreements $ 1,334,833 $ 1,268,226 $ 658,554 $ 3,261,613 Net Assets $ 898,020 $ 2,342,651 $ 123,987 $ 3,364,658 All data as of December 31, 2021 $ in thousands (1) Includes $820 million of loans accounted for as secured borrowings and $608 million of securitized debt (non-recourse). (2) Excludes approximately $454 million of Loans held for investment for December 31, 2021, which were purchased prior to that reporting date and settled subsequent to that reporting period.. NET ASSET BREAKDOWN Chimera invests in RMBS securities and securities created through the CIM Sponsored securitizations. Loans are financed through Financing Trusts.
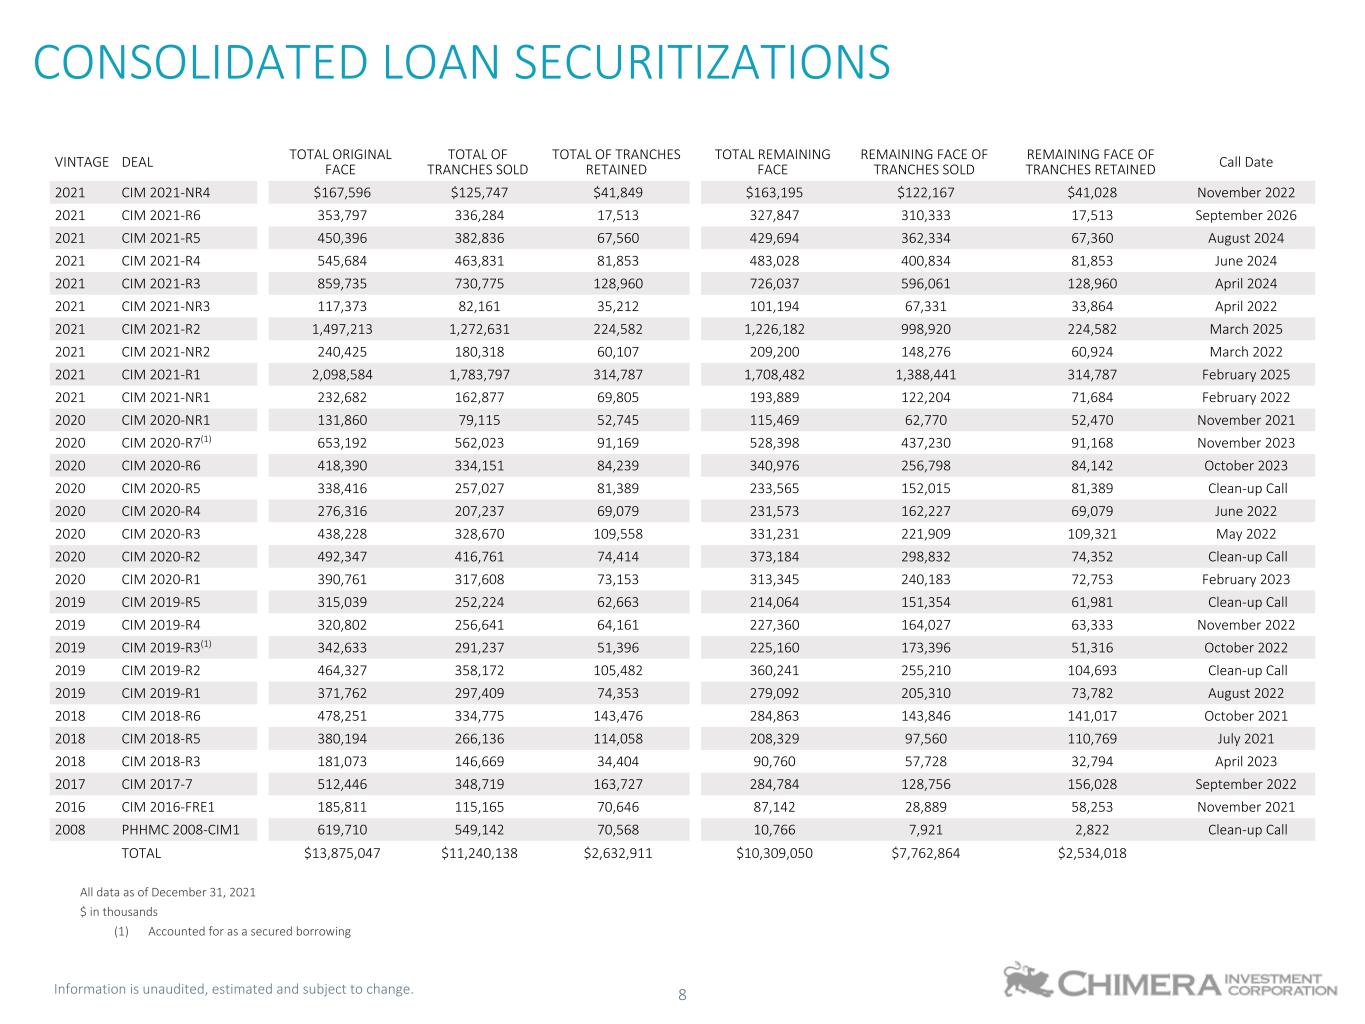
Information is unaudited, estimated and subject to change. 8 VINTAGE DEAL TOTAL ORIGINAL FACE TOTAL OF TRANCHES SOLD TOTAL OF TRANCHES RETAINED TOTAL REMAINING FACE REMAINING FACE OF TRANCHES SOLD REMAINING FACE OF TRANCHES RETAINED Call Date 2021 CIM 2021-NR4 $167,596 $125,747 $41,849 $163,195 $122,167 $41,028 November 2022 2021 CIM 2021-R6 353,797 336,284 17,513 327,847 310,333 17,513 September 2026 2021 CIM 2021-R5 450,396 382,836 67,560 429,694 362,334 67,360 August 2024 2021 CIM 2021-R4 545,684 463,831 81,853 483,028 400,834 81,853 June 2024 2021 CIM 2021-R3 859,735 730,775 128,960 726,037 596,061 128,960 April 2024 2021 CIM 2021-NR3 117,373 82,161 35,212 101,194 67,331 33,864 April 2022 2021 CIM 2021-R2 1,497,213 1,272,631 224,582 1,226,182 998,920 224,582 March 2025 2021 CIM 2021-NR2 240,425 180,318 60,107 209,200 148,276 60,924 March 2022 2021 CIM 2021-R1 2,098,584 1,783,797 314,787 1,708,482 1,388,441 314,787 February 2025 2021 CIM 2021-NR1 232,682 162,877 69,805 193,889 122,204 71,684 February 2022 2020 CIM 2020-NR1 131,860 79,115 52,745 115,469 62,770 52,470 November 2021 2020 CIM 2020-R7(1) 653,192 562,023 91,169 528,398 437,230 91,168 November 2023 2020 CIM 2020-R6 418,390 334,151 84,239 340,976 256,798 84,142 October 2023 2020 CIM 2020-R5 338,416 257,027 81,389 233,565 152,015 81,389 Clean-up Call 2020 CIM 2020-R4 276,316 207,237 69,079 231,573 162,227 69,079 June 2022 2020 CIM 2020-R3 438,228 328,670 109,558 331,231 221,909 109,321 May 2022 2020 CIM 2020-R2 492,347 416,761 74,414 373,184 298,832 74,352 Clean-up Call 2020 CIM 2020-R1 390,761 317,608 73,153 313,345 240,183 72,753 February 2023 2019 CIM 2019-R5 315,039 252,224 62,663 214,064 151,354 61,981 Clean-up Call 2019 CIM 2019-R4 320,802 256,641 64,161 227,360 164,027 63,333 November 2022 2019 CIM 2019-R3(1) 342,633 291,237 51,396 225,160 173,396 51,316 October 2022 2019 CIM 2019-R2 464,327 358,172 105,482 360,241 255,210 104,693 Clean-up Call 2019 CIM 2019-R1 371,762 297,409 74,353 279,092 205,310 73,782 August 2022 2018 CIM 2018-R6 478,251 334,775 143,476 284,863 143,846 141,017 October 2021 2018 CIM 2018-R5 380,194 266,136 114,058 208,329 97,560 110,769 July 2021 2018 CIM 2018-R3 181,073 146,669 34,404 90,760 57,728 32,794 April 2023 2017 CIM 2017-7 512,446 348,719 163,727 284,784 128,756 156,028 September 2022 2016 CIM 2016-FRE1 185,811 115,165 70,646 87,142 28,889 58,253 November 2021 2008 PHHMC 2008-CIM1 619,710 549,142 70,568 10,766 7,921 2,822 Clean-up Call TOTAL $13,875,047 $11,240,138 $2,632,911 $10,309,050 $7,762,864 $2,534,018 All data as of December 31, 2021 $ in thousands (1) Accounted for as a secured borrowing CONSOLIDATED LOAN SECURITIZATIONS
chimerareit.com